The world economy is interconnected, and international trade is one of the strongest indicators of global growth. Every year, businesses, policymakers, and researchers look forward to the Global Trade Outlook and Statistics (GTOS) reports published by the World Trade Organization (WTO). These reports provide forecasts and data on how goods and services are moving across borders, which regions are leading in exports and imports, and how policies, tariffs, and global events are shaping trade patterns.
The GTOS reports are now released twice a year in April (main forecast) and in October (update). In this blog, we’ll explore what these reports are about, highlight key figures from recent editions, and explain why they are important for anyone tracking the global economy.
What is the Global Trade Outlook and Statistics Report?
Before diving into numbers, it’s important to understand the purpose of the GTOS report.
The Global Trade Outlook and Statistics reports provide:
- A short-term forecast for world merchandise and services trade.
- Statistical snapshots of trade by region, sector, and category.
- Special focus sections on risks like tariffs, trade policy uncertainty, shipping bottlenecks, and inflation.

Since 2023, the WTO has moved to a biannual cycle:
- April editions: full forecast and statistical tables.
- October updates: revisions and risk assessments.
This format makes it easier to track trade momentum through the year and gives businesses early warning about possible disruptions.
Key Figures from the Latest Reports
The latest editions show how quickly trade forecasts can change. Here’s a table of global merchandise trade growth figures:
| Year | Trade Growth (Merchandise, %) | Notes |
| 2023 | -1.2% | Contraction due to weak demand and geopolitical tensions. |
| 2024 | +2.9% | Actual growth, slightly stronger than expected in late 2023. |
| 2025 (Baseline) | +2.7% | Forecast under low-tariff assumptions. |
| 2025 (Adjusted) | -0.2% | Forecast after including new tariffs and trade uncertainty. |

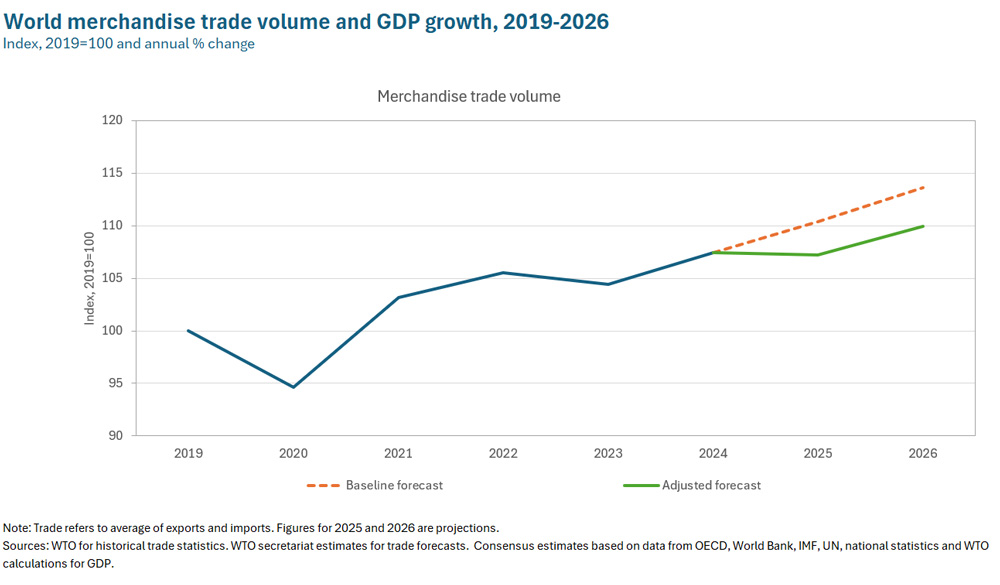
Why Did the Outlook Change in 2025?
The April 2024 forecast was quite optimistic, expecting a recovery in trade after the 2023 contraction. But the April 2025 edition turned much more cautious.
The reasons are:
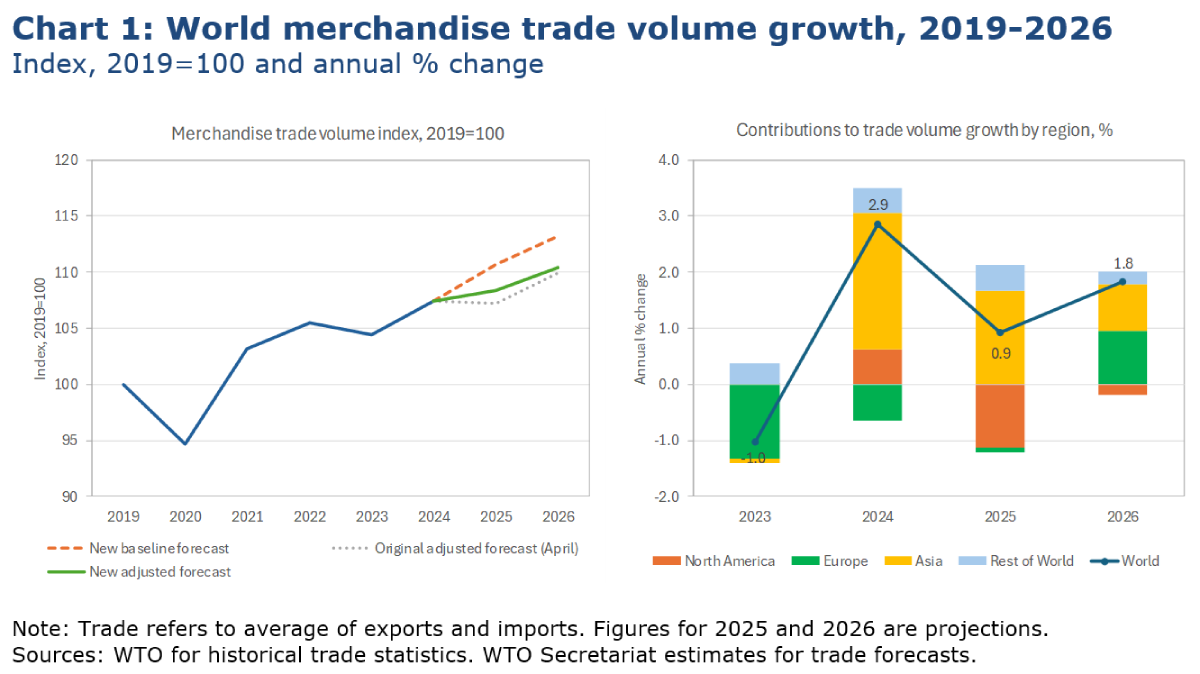
- Tariffs and Policy Uncertainty: New tariffs introduced by large economies and uncertainty about future trade rules reduced business confidence. The WTO simulations show that compared with a “no new tariffs” baseline, actual policies cut trade growth by almost 3 percentage points in 2025.
- Geopolitical Tensions & Shipping Issues: Conflicts in different regions and disruptions in key shipping lanes (like the Panama Canal and Suez Canal) increased costs and slowed delivery times.
- Financial Conditions: While inflation eased in many economies, high interest rates and cautious investment reduced the pace of recovery.
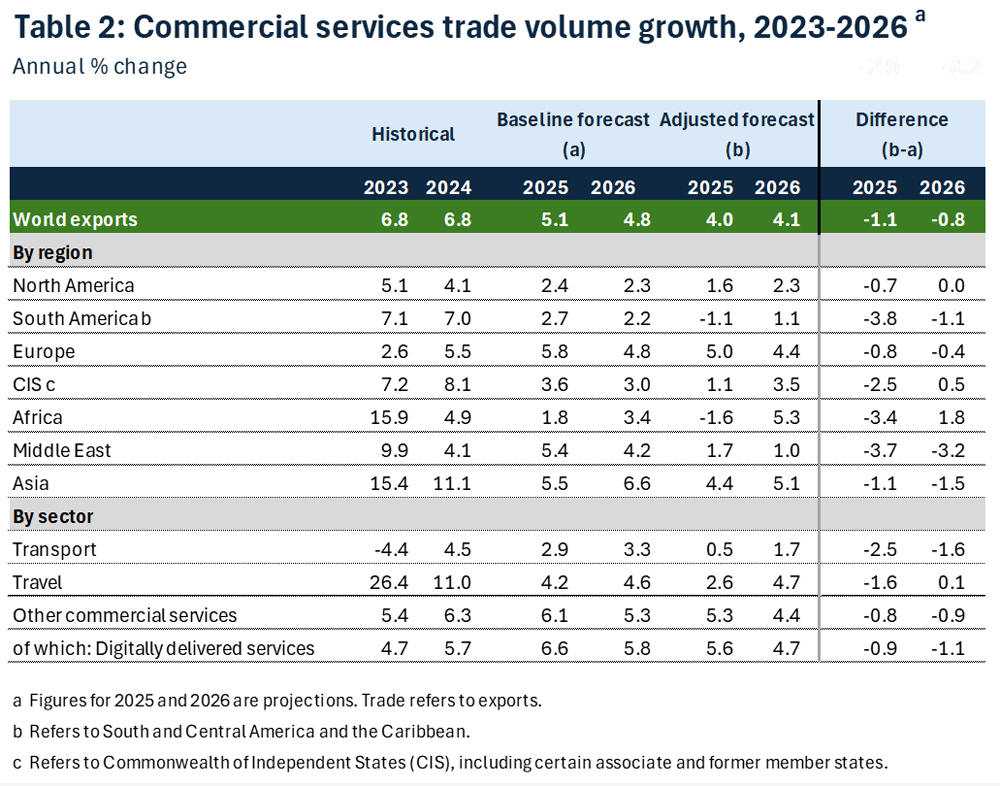
Regional and Sectoral Highlights
Trade performance is never uniform across the world. Some regions and sectors do better than others depending on demand, supply chains, and policies.
- Europe: Intra-EU trade fell by about 3.2% in 2024, pulling down global totals despite resilience in other regions.
- Asia: Exports from Asia were stronger than expected during 2024, though they slowed in the last quarter.
- Least-Developed Countries (LDCs): For the first time, LDCs’ share of world exports crossed 1.1% in 2024 a small but significant achievement.
- Sectors: Manufacturing showed mixed growth, but services (especially digitally delivered services) continued to expand, cushioning overall trade.
| Region / Category | 2024 Performance | Outlook for 2025 |
| Europe (Intra-EU) | -3.2% | Modest recovery expected |
| Asia | Strong growth early 2024 | Easing late 2024, uncertain in 2025 |
| LDCs | 1.12% share of exports | Gradual increase expected |
| Digital Services | 14.5% of total exports | Growth likely to continue |

Why These Reports Matter and Where to Access Them
The Global Trade Outlook and Statistics reports are more than just numbers. They are a vital tool for:
- Businesses: Companies use them to plan supply chains and market expansion.
- Policymakers: Governments rely on them for trade negotiations and tariff planning.
- Students & Researchers: They serve as reliable data sources for academic projects and economic research.
| Year | Download Link |
| April 2025 | Download PDF |
| October 2024 | Download PDF |
| April 2024 | Download PDF |
| October 2023 | Download PDF |
| April 2023 | Download PDF |
If you are preparing for exams like RBI Grade B, you can check out the detailed RBI Grade B notification which is expected to be out between 8th to 14th September 2025.
FAQs
The Global Trade Outlook and Statistics (GTOS) Report is published by the WTO and provides forecasts, data, and analysis on world trade in goods and services, including regional and sectoral performance.
The WTO releases the GTOS reports twice a year — a full forecast in April and an update in October.
The 2025 outlook turned cautious due to new tariffs, policy uncertainty, geopolitical tensions, shipping disruptions, and tighter financial conditions.
Asia showed strong export growth in 2024, while Europe’s intra-EU trade fell. Least-Developed Countries (LDCs) achieved a record 1.1% share of world exports.
You can download the latest Global Trade Outlook and Statistics reports directly from the WTO’s official website under the publications and statistics section.
- Law of Supply & Elasticity of Supply, Check All Details
- Law of Demand and Its Exceptions Explained with Examples

- PFRDA Grade A Exam Analysis 2025, Phase Wise Difficulty Level

- India’s G20 Presidency, Economic Impact, Theme & Achievement

- Concepts of Economies of Scale & Diseconomies of Scale
- Marginal Cost & Marginal Revenue Relationship with Exam Notes