Understanding the Marginal Cost & Marginal Revenue Relationship is crucial for economics aspirants and especially for candidates preparing for regulatory exams like RBI Grade B, SEBI Grade A, NABARD, IFSCA, and EPFO. In this blog, we’ll cover the basics, connect them with current trends, and share exam-ready notes with examples, diagrams, and practice material.
Understanding Definition & Rule
Marginal Cost (MC) and Marginal Revenue (MR) are fundamental concepts in microeconomics. They guide firms in making production and pricing decisions.
- Marginal Cost (MC): The extra cost of producing one more unit of output.
- Marginal Revenue (MR): The extra revenue earned by selling one more unit of output.
- Profit Maximisation Rule: A firm maximises profit when MR = MC.
In perfect competition, MR = Price, so equilibrium occurs at P = MC.
In monopoly/oligopoly, MR < Price, so equilibrium occurs at MR = MC but P > MC.
| Market Type | MR Curve | Profit Condition | Example Industry |
| Perfect Competition | Horizontal line | MR = MC = P | Agriculture (wheat, rice) |
| Monopoly | Downward sloping | MR = MC < Price | Railways, Pharma |
| Oligopoly | Kinked demand | MR = MC | Telecom, Airlines |
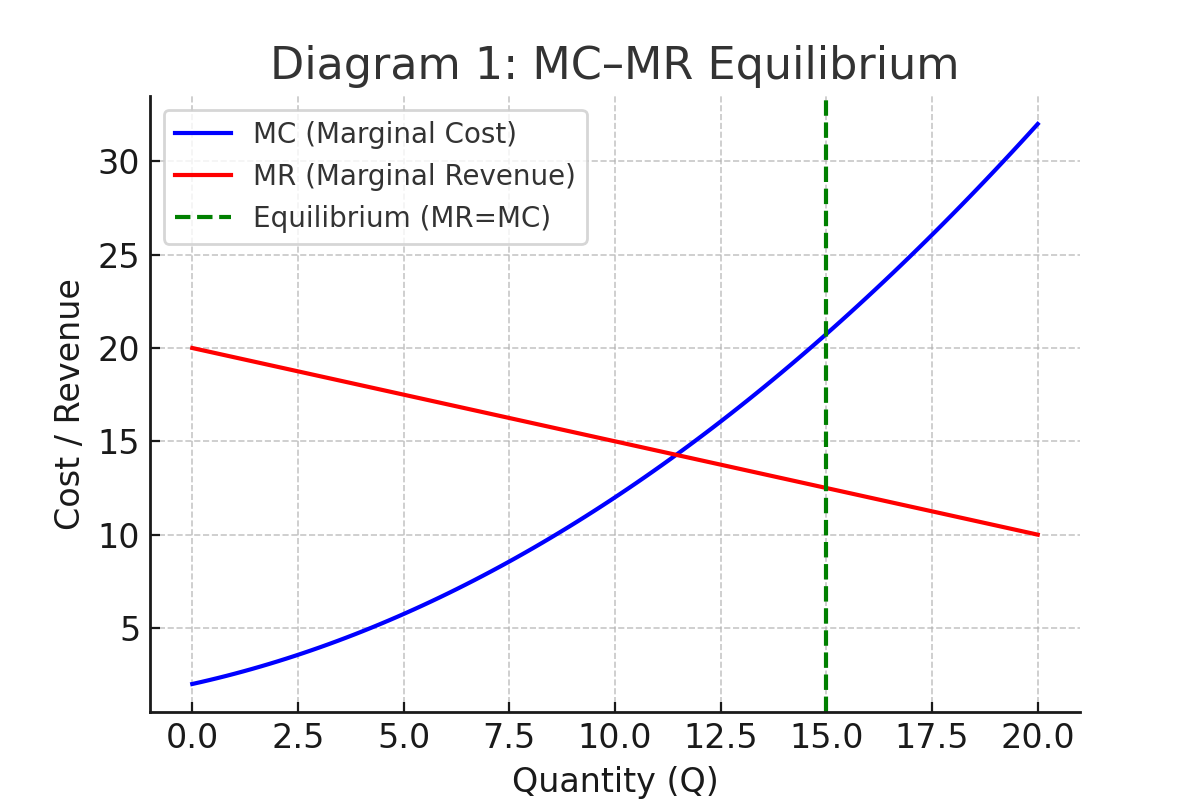
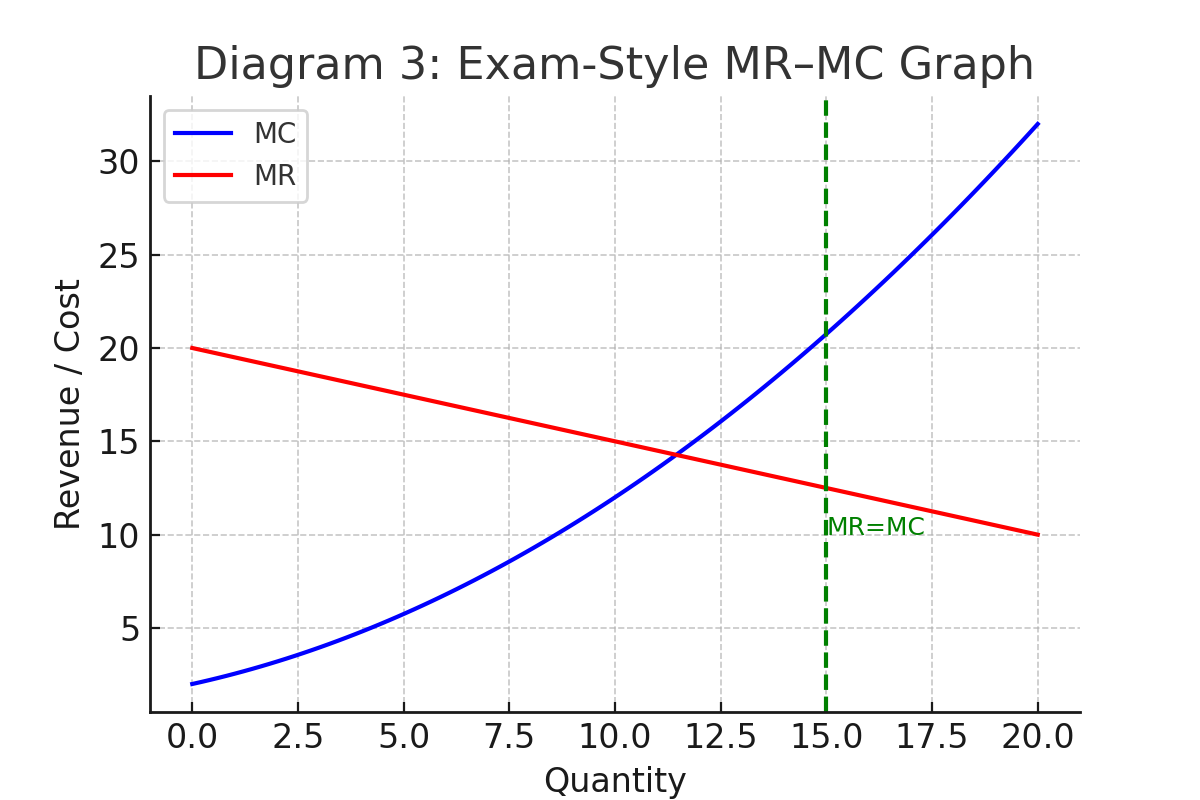
To understand the relationship clearly, look at the MC–MR equilibrium graph below. The intersection point shows where profit is maximized

Current Trends on MC and MR
Today’s markets show how MC and MR behave differently across industries:
- Digital Goods: MC is almost zero (adding new users costs nothing), but server/AI infra adds costs.
- Automation in Manufacturing: Robotics lower MC per unit, allowing larger production.
- Dynamic Pricing: Airlines and e-commerce adjust MR constantly using AI pricing.
- Subscription Models: MR is more stable due to recurring revenues.
| Industry | MC Trend | MR Pattern | Example Case |
| Digital Services | Near-zero | Stable (subscriptions/ads) | Netflix, Spotify |
| Airlines | Moderate | Fluctuates with AI pricing | Emirates, Indigo |
| Automobiles | Declining (robots) | Volume-driven pricing | Tesla, Toyota |
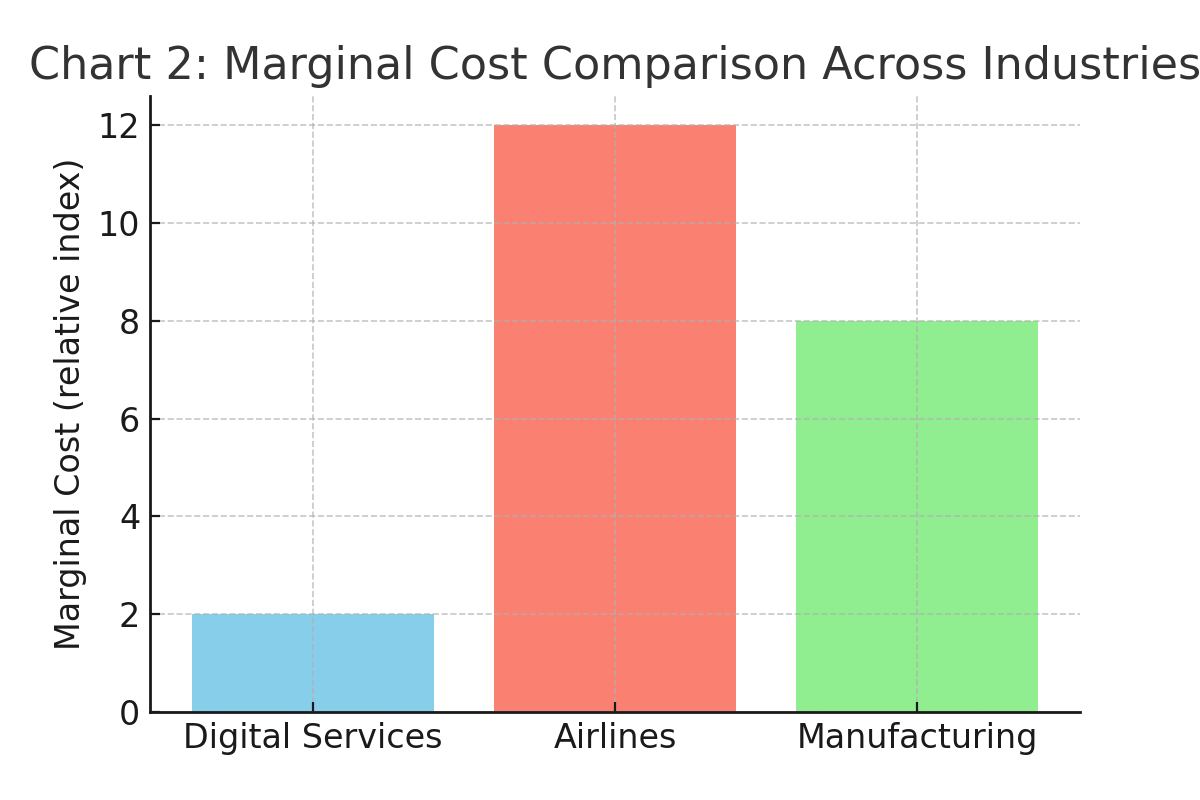
The bar chart below compares marginal costs across three major sectors: digital services, airlines, and manufacturing:
How to Write This in a 10 Mark Exam Answer?
Examiners look for clarity, structure, and diagrams in answers. If you can explain MR–MC in simple terms, support it with a diagram, and conclude with a rule, you can easily score 8–10 marks. Here’s a model approach for exams like RBI Grade B, SEBI Grade A, NABARD, UPSC Economics:
- Definition: Write short definitions of MC and MR.
- Graph: Draw MR curve (downward) + U-shaped MC curve, show MR = MC point.
- Explanation: Profit maximisation rule — equilibrium where MR = MC.
- Application: Give one current example (AI pricing, digital products).
- Conclusion: State that MR = MC is universal for profit maximisation.
In exams, you should always draw a labelled MR–MC diagram. Here’s an example of a standard exam-style graph.
Common Pitfalls to Avoid in Exams
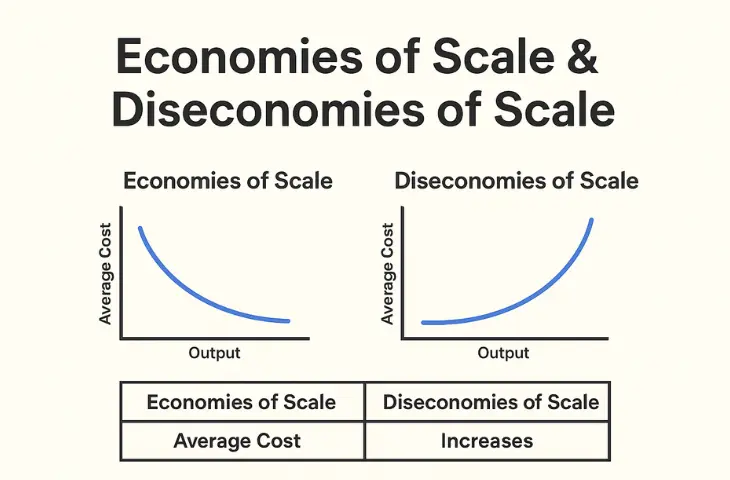
- Confusing Average Cost (AC) with Marginal Cost (MC).
- Assuming MR = Price in all markets (only true in perfect competition).
- Forgetting to mention MC cuts MR from below at equilibrium.
Always conclude: Profit maximisation occurs where MR = MC, provided MC is rising.
Short Numerical Example
Numbers make the concept crystal clear. A simple table showing cost and revenue at different output levels helps you see how MR = MC determines the profit-maximising point.
| Quantity (Q) | Total Cost (TC) | MC | Total Revenue (TR) | MR | Decision |
| 9 | ₹900 | – | ₹1260 | – | – |
| 10 | ₹1020 | ₹120 | ₹1320 | ₹60 | MR < MC → Don’t expand |
Here, profit is maximised at Q = 9 units, because beyond this MR < MC.
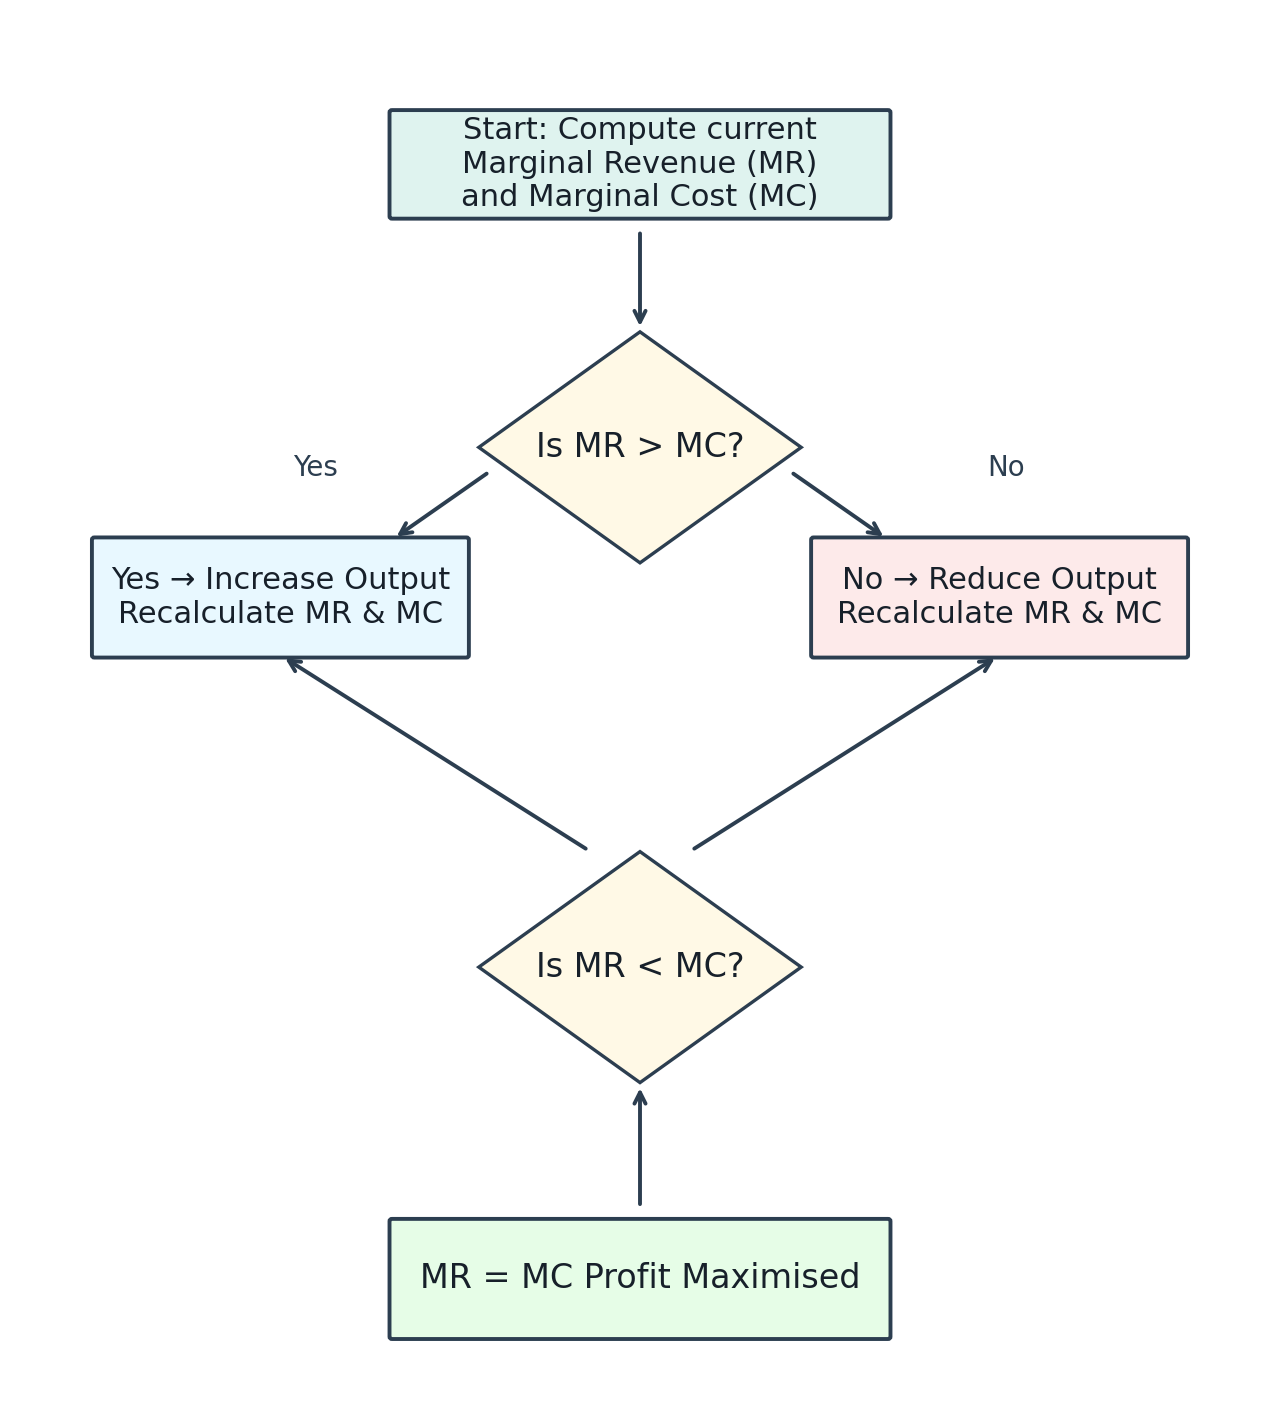
The following flowchart helps in making decisions about whether to expand or stop production depending on the MR and MC relationship.

Use-Cases in Real Markets
The MR–MC principle is not limited to textbooks it drives real business strategies. From automation reducing marginal costs to digital platforms stabilising marginal revenue, firms use this relationship to set output and pricing decisions.
- Streaming Platforms: MC ≈ 0 → firms focus on revenue through ads & subscriptions.
- Automobiles: Lower MC from automation → higher optimal production.
- Airlines: MR depends on seat pricing → AI maximises revenue.
| Industry | MC Behaviour | MR Behaviour | Outcome |
| Digital Apps | Near zero | Stable subscriptions | Focus on scaling users |
| Cars | Declining | Price competition | Higher production levels |
| Airlines | Moderate | AI dynamic pricing | Maximise per-seat profit |
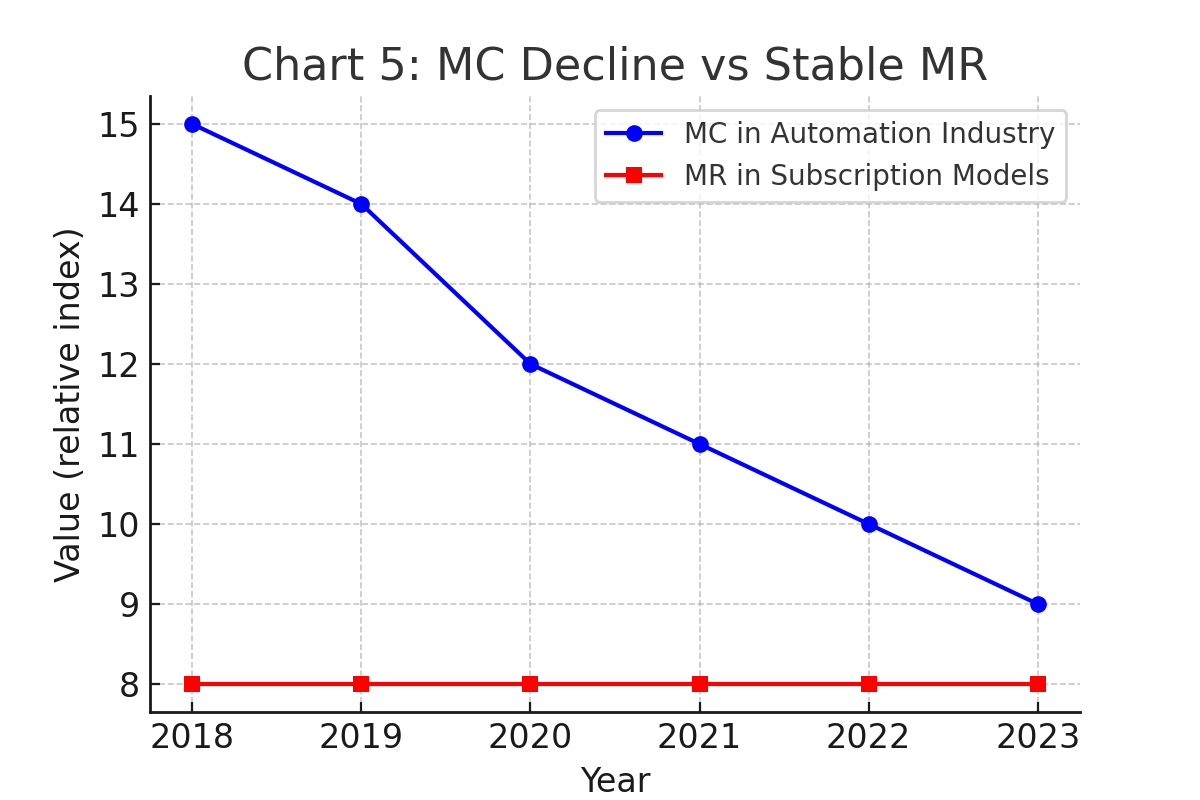
The line graph below highlights how automation lowers marginal cost over time, while subscription models keep marginal revenue relatively stable.
Take the 10-Minute MC/MR Quiz
Test your understanding of Marginal Cost & Revenue with mock tests that cover profit maximisation questions:
| Exam Name | Section Where It Appears | Mock Test Link |
| RBI Grade B | ESI & Microeconomics | RBI Grade B Mock Test |
| SEBI Grade A | Paper 1: Economics Basics | SEBI Grade A Mock Test |
| NABARD Grade A | Agriculture & ESI | NABARD Grade A Mock Test |
| IFSCA Grade A | Economics in Paper 2 | IFSCA Grade A Mock Test |
| EPFO EO/AO | Microeconomics Concepts | EPFO EO/AO Mock Test |
FAQs
A1. The relationship shows that profit is maximised where Marginal Cost (MC) = Marginal Revenue (MR). If MR > MC, production should expand; if MR < MC, production should reduce.
A2. Because it is the universal profit maximisation rule, commonly asked in exams like RBI Grade B, SEBI Grade A, NABARD, and UPSC Economics.
A3. The firm earns extra profit by producing more, so output should be increased until MR = MC.
A4. Yes. In monopoly, profit is still maximised where MR = MC, but price (P) will be greater than MC.
A5. Define MC and MR, draw a neat graph showing MR = MC, explain the rule in 3–4 sentences, and conclude that equilibrium output is where MR = MC and MC is rising.
- Climate Change & COP Summits, Key Agreements & Paris Deal

- Law of Supply & Elasticity of Supply, Check All Details
- Law of Demand and Its Exceptions Explained with Examples

- PFRDA Grade A Exam Analysis 2025, Phase Wise Difficulty Level

- India’s G20 Presidency, Economic Impact, Theme & Achievement

- Concepts of Economies of Scale & Diseconomies of Scale