


Almost in every exam, be it Banking, SSC, Railway (RRB NTPC), Insurance, or any other government exam we find questions on data interpretation everywhere. Data interpretation or DI is a method of representing data into various forms such as Tables, Bar graphs, Line graphs, Pie charts, etc. Data can be obtained from multiple sources and then it is reviewed, analyzed, and interpreted to arrive at an inference.
Register Here to Take A Free Mock Test Now
What are Pie Charts?
One of the most important and frequent forms of representing data is through pie charts. Data Interpretation Questions based on pie charts are often asked in the exams. In this article, we will learn simple yet important tips and techniques to solve the pie chart quickly.
A pie chart is a circular shaped chart, as the name suggested, it is like a pie divided into multiple sectors or slices to represent numerical data. In a pie chart, the length of the arc or central angle is proportional to the quantity that it represents.
Register here for free Study Material PDFs.
Data in the pie chart
In a pie chart, data is mainly represented:
In the form of percent, in the case of percent distribution sum of the pie chart is 100%.
In the form of degree, in the case of degree distribution sum of the pie chart is 360°.
Be exam ready with our Math Coach Feature – Try it for Free Here
Read Here to Find Tips and Tricks to Increase your Calculation Speed
Read data in the pie chart
Each pie chart sums up to a certain value which is equivalent to 100% or 360° based on the type of distribution (whether it is percent or degree).
To find the value of certain a sector (slice):
- If the distribution is given in percent, simply multiply this value to the total amount of data and then divide by 100.
- If the distribution is given in percent, simply multiply this value to the total amount of data and then divide by 360.
Example 1:
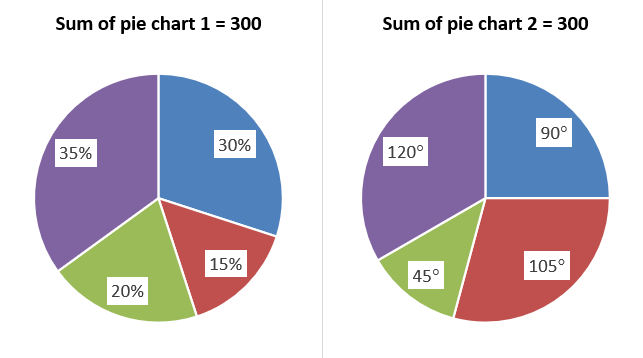

Solution:
Value of 3rd quarter of pie chart 1 = = 60
Value of 2nd quarter of pie chart 2 = = 87.5
For Free Practice Questions Register here.
Conversion of data of one type of distribution to another type:
Conversion of one type of distribution in a pie chart to another type is very simple:
To convert percentage into degree, just multiple the percent value with ‘3.6’.
To convert degree into percent, just divide the degree value with ‘3.6’.
Example 2:
Convert 25% into degree and 90° into percent.
Solution:
Equivalent of 25% in degree = 25 * 3.6 = 90°
Equivalent of 90° in percent = = 25%
For Free Practice Questions Register here.
Analysis of pie charts:
You just do not need to calculate the value of each sector of the pie chart every time. Each set of pie charts contains 2 or 3 questions based on the comparison of data such as ratio and percentage.
Example 3:
Find the ratio of the value of the 2nd quarter to the value of the 4th quarter.

Solution:
Required ratio = 15%: 35% = 15: 35 = 3: 7
Also, if you need to perform aggregate functions such as sum, average, the difference in data values of sectors, then-
First, perform that function on data values of the sector and then calculate the final value.
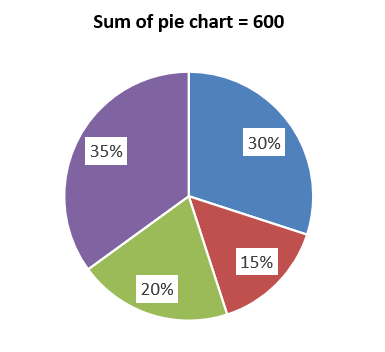
Example 4:
Find the sum of values of the sum of the 1st and the 3rd sector of the pie chart.
Solution:
Sum of data values of 1st sector and 3rd sector = 30% + 20% = 50%
Required sum = 50% of 600 = 300
Now, we will discuss how to scale one pie chart into another, when two different pie charts (both are either in percent distribution or in degree distribution) are given in a single question.
Step 1: Find the total amount of both the pie charts.
Step 2: Find the scale factor by dividing the total amount of the first pie chart by the total amount of the second pie chart.
Step 3: Multiply each value of the first pie chart by the scale factor.
Step 4: Represent value multiplied by the scale factor of the first chart and the original value of the second pie chart in a single pie chart.
Step 5: Total amount of that single pie chart is equivalent to the total amount of the second pie chart.
Example 5:
Find the difference between the value of the first sector of both the pie charts.
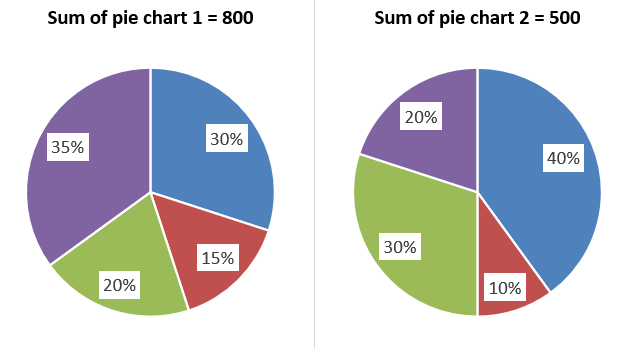

Solution:
Step 1: Total amount of first and second pie charts is 800 and 500, respectively.
Step 2: Scale factor = = 1.6
Step 3: Now, the value of each sector of the first pie chart be like 48%, 24%, 32%, and 56% of successive quarters.
Step 4:
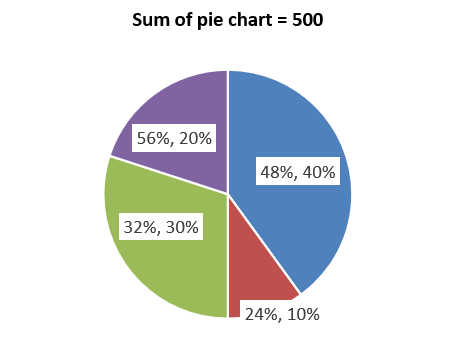

Required difference = (48 – 40) % of 500 = 8% of 500 = 40
This is all from us.
Hope this article will be helpful for your preparation and all the best for your upcoming exams.
For Free Practice Questions Register here.
For High-Level DI Questions, Register here.
Solve DI based on Time and Work Here
Attempt Various Free Mock Tests Here: Topic Tests, Sectional Tests, and Full Mock Tests.
Study at your own convenience anywhere. Download the Oliveboard app now!


Hello, I’m Aditi, the creative mind behind the words at Oliveboard. As a content writer specializing in state-level exams, my mission is to unravel the complexities of exam information, ensuring aspiring candidates find clarity and confidence. Having walked the path of an aspirant myself, I bring a unique perspective to my work, crafting accessible content on Exam Notifications, Admit Cards, and Results.
At Oliveboard, I play a crucial role in empowering candidates throughout their exam journey. My dedication lies in making the seemingly daunting process not only understandable but also rewarding. Join me as I break down barriers in exam preparation, providing timely insights and valuable resources. Let’s navigate the path to success together, one well-informed step at a time.