

Caselet DI Questions for SBI PO Exam 2025: Data Interpretation (DI) is a critical part of the SBI PO exam, testing candidates’ ability to analyze structured datasets in textual or tabular formats. Among these, Caselet DI questions are particularly significant as they combine analytical thinking and mathematical skills. These problems require interpreting small datasets and applying operations such as percentages, ratios, averages, and comparisons to arrive at solutions. Mastery of these questions can greatly enhance a candidate’s score in the exam.
Importance of Caselet DI in SBI PO
Caselet DI questions assess calculation speed, logical reasoning, and decision-making skills. These questions emphasize understanding data patterns and drawing meaningful conclusions. With consistent practice and a good command of mathematical concepts, candidates can improve accuracy and speed in solving Caselet DI problems.
Below are a few examples of Caselet DI questions for the SBI PO 2025 Exam, offering aspirants a chance to practice and strengthen their preparation.
Caselet DI Questions for SBI PO Exam 2025 for Practice
Caselet 1
In a school, there are 120 students who like three types of sports: Football, Basketball, and Cricket. The number of students who like only Football is 40% of those who like only Basketball. Students who like all three sports are 25% of those who like only Football. The number of students who like only Cricket is double the number of students who like both Football and Cricket but not Basketball.
Questions:
- How many students like only Football?
- What is the total number of students who like Football, Basketball, and Cricket?
- Find the number of students who like both Football and Basketball but not Cricket.
- What percentage of the total students like only Cricket?
- What is the ratio of students who like only Football to those who like all three sports?
Caselet 2
In a tech company, 300 employees are divided into 3 departments: IT, HR, and Marketing. The number of employees in IT is twice that in Marketing. HR has 50 employees less than Marketing. 60% of IT employees are males, and 75% of Marketing employees are females.
Questions:
- How many employees are there in HR?
- How many males work in IT?
- What is the total number of females in Marketing?
- What is the ratio of males in IT to females in Marketing?
- What is the percentage of males in HR compared to the total number of employees?
Caselet 3
The sales ratio of Product A to Product B in January is 3:2. The total sales of both products in February were 25% higher than in January. In March, the sales of Product A were 10% less than in January, and the sales of Product B were 20% more than in January.
Questions:
- If the sales of Product A in January were 300 units, how many units of Product B were sold in January?
- What were the total sales in February?
- How many units of Product A were sold in March?
- Find the percentage increase in the total sales from January to March.
- What is the ratio of sales of Product A in January to the total sales in March?
Caselet 4
A survey of 500 people was conducted to know the number of people using different social media platforms: Facebook, Instagram, and Twitter. 60% of the total participants use Facebook, 40% use Instagram, and 20% use Twitter. 15% of the participants use all three platforms. 10% use both Facebook and Instagram but not Twitter.
Questions:
- How many people use only Facebook?
- What is the total number of people who use Instagram?
- How many people use both Facebook and Instagram but not Twitter?
- What is the percentage of people who use at least two platforms?
- Find the number of people who use only Twitter.
Caselet 5
In a city, 5000 households were surveyed for their preference for transportation. 35% prefer using cars, 25% use bikes, and 40% use public transport. 20% of the households use both cars and bikes, while 15% use both cars and public transport. The number of households using all three is 10%.
Questions:
- How many households use only cars?
- What is the total number of households using bikes or cars?
- Find the percentage of households that use only public transport.
- What is the total number of households using at least two types of transportation?
- What is the ratio of households using only cars to those using all three types?
Caselet 6
In a company, there are 400 employees divided into three departments: Sales, Marketing, and Customer Support. The ratio of Sales to Marketing employees is 3:2, and the ratio of Marketing to Customer Support employees is 5:4. The total number of employees in the company is 400.
Questions:
- How many employees work in the Sales department?
- How many employees work in the Marketing department?
- What is the number of employees in Customer Support?
- What is the total number of Marketing and Customer Support employees?
- What is the ratio of employees in the Sales department to the total number of employees in the company?
Caselet 7
A total of 200 students in a college are taking part in sports activities. 60% of the students are participating in Football, 50% in Basketball, and 40% in Cricket. 20% of the students are participating in all three sports. The number of students participating in only Basketball is 30.
Questions:
- How many students participate in only Football?
- What is the total number of students who participate in both Football and Basketball but not Cricket?
- Find the number of students who participate in only Cricket.
- What is the percentage of students who participate in at least two sports?
- What is the ratio of students who participate in only Football to those who participate in all three sports?
Caselet 8
In a retail store, the sales ratio of Laptops to Smartphones in January is 5:3. The total sales in February are 30% higher than in January. The sales of Smartphones in March are 15% more than in January, and the sales of Laptops in March are 5% less than in January.
Questions:
- If the sales of Laptops in January were 500, how many Smartphones were sold in January?
- What were the total sales in February?
- How many Laptops were sold in March?
- Find the percentage increase in sales of Smartphones from January to March.
- What is the ratio of Laptops sold in January to total sales in March?
Caselet 9
A survey in a school shows that 150 students prefer Mathematics, 100 prefer Science, and 80 prefer both subjects. 20% of the students prefer both subjects and English. The total number of students surveyed is 200.
Questions:
- How many students prefer only Mathematics?
- How many students prefer only Science?
- What is the total number of students who prefer Mathematics or Science?
- Find the number of students who prefer both Mathematics and English.
- What percentage of students prefer only one subject?
Caselet 10
In a company, there are 1200 employees. 30% of employees are in IT, 40% are in HR, and 30% are in Finance. 20% of IT employees are females, 60% of HR employees are males, and 70% of Finance employees are females.
Questions:
- How many females work in IT?
- What is the total number of males in HR?
- What percentage of employees are males in Finance?
- How many females work in HR and IT combined?
- What is the ratio of males in IT to females in Finance?
Caselet 11
In a survey of 500 people, 60% prefer tea, 30% prefer coffee, and 15% prefer both tea and coffee. 10% of the total survey population prefers neither tea nor coffee.
Questions:
- How many people prefer only tea?
- What is the total number of people who prefer either tea or coffee?
- Find the percentage of people who prefer only coffee.
- How many people prefer neither tea nor coffee?
- What is the ratio of people who prefer tea to those who prefer both tea and coffee?
Caselet 12
In a city, 800 households were surveyed about internet usage. 50% of households use Wi-Fi, 40% use broadband, and 30% use both. The total number of households using Wi-Fi or broadband is 700.
Questions:
- How many households use only Wi-Fi?
- How many households use both Wi-Fi and broadband?
- What is the total number of households that use broadband only?
- What percentage of households use both types of internet connections?
- What is the ratio of households using only Wi-Fi to those using only broadband?
Caselet 13
In a study, 500 people were asked about their transportation preferences. 40% prefer cars, 30% prefer bikes, and 20% prefer public transport. 10% prefer both cars and bikes, and 5% prefer both cars and public transport.
Questions:
- How many people prefer only bikes?
- What is the total number of people who prefer both cars and public transport?
- How many people prefer only cars?
- What is the percentage of people who prefer only public transport?
- What is the ratio of people who prefer only cars to those who prefer only bikes?
Caselet 14
A total of 600 employees are working in a company. 50% of the employees are in the IT department, 30% are in Marketing, and the rest are in the HR department. 40% of IT employees are females, 50% of Marketing employees are males, and 60% of HR employees are females.
Questions:
- How many employees work in the HR department?
- How many females work in IT?
- What is the total number of males in Marketing?
- How many females work in the entire company?
- What is the ratio of males in Marketing to females in HR?
Caselet 15
In a college, 1000 students were surveyed to determine their preference for online courses. 60% of the students prefer online courses, and 40% prefer offline courses. 15% of the students prefer both online and offline courses.
Questions:
- How many students prefer only online courses?
- What is the total number of students who prefer either online or offline courses?
- How many students prefer only offline courses?
- What percentage of students prefer both online and offline courses?
- What is the ratio of students who prefer only online courses to those who prefer both?
Caselet 16
In a retail store, the sales ratio of Shoes to Bags in January is 4:3. The total sales in February are 15% higher than in January. In March, the sales of Shoes are 10% more than in January, and the sales of Bags are 5% less than in January.
Questions:
- If the sales of Shoes in January were 400, how many Bags were sold in January?
- What were the total sales in February?
- How many Shoes were sold in March?
- Find the percentage increase in total sales from January to March.
- What is the ratio of Shoes sold in January to the total sales in March?
Caselet 17
In a factory, 1000 items are produced in a day. 60% of the items are defective, 20% are non-defective, and 20% are substandard. 50% of the substandard items are defective.
Questions:
- How many defective items are produced in a day?
- What is the total number of substandard items?
- How many non-defective items are produced?
- What is the percentage of defective items compared to non-defective items?
- What is the ratio of substandard items to defective items?
Caselet 18
In a survey of 400 employees, 60% work from home, 20% work in the office, and 20% work both from home and office. The percentage of employees working from home is 1.5 times that of those working in the office.
Questions:
- How many employees work from home only?
- What is the total number of employees working both from home and office?
- How many employees work in the office only?
- What percentage of employees work either from home or the office?
- What is the ratio of employees working from home to those working both from home and office?
Caselet 19
In a survey, 700 students were asked about their sports preferences. 40% of students prefer Football, 30% prefer Basketball, and 30% prefer both.
Questions:
- How many students prefer only Football?
- What is the total number of students who prefer either Football or Basketball?
- Find the number of students who prefer both sports.
- What is the percentage of students who prefer only Basketball?
- What is the ratio of students who prefer only Football to those who prefer both sports?
Caselet 20
In a factory, 1500 units of product are manufactured. 40% of the units are defective, 30% are non-defective, and 30% are substandard. 10% of the substandard units are non-defective.
Questions:
- How many defective units are produced?
- How many non-defective units are substandard?
- What is the total number of substandard units?
- What percentage of defective units are substandard?
- What is the ratio of non-defective units to substandard units?
Solutions
Caselet 1
- How many students like only Football?
- Let xxx be the number of students who like only Basketball.
- Then the number of students who like only Football = 0.4×0.4×0.4x.
- Students who like all three sports = 0.25 × 0.4x = 0.1x.
- Students who like only Cricket = 2 × (students who like Football and Cricket but not Basketball) = 2 × (0.4x – 0.1x) = 0.6x.
- Total students = 120, so: 0.4x+x+0.1x+0.6x=1200.4x + x + 0.1x + 0.6x = 1200.4x+x+0.1x+0.6x=120 Solving for xxx, we get x=40x = 40x=40. Therefore, the number of students who like only Football = 0.4×40=160.4 \times 40 = 160.4×40=16.
- What is the total number of students who like Football, Basketball, and Cricket?
- Total = Students who like only Football + only Basketball + only Cricket + all three.
- Total = 16 + 40 + 24 + 4 = 84.
- Find the number of students who like both Football and Basketball but not Cricket.
- This is 0.4x−0.1x=0.3×0.4x – 0.1x = 0.3×0.4x−0.1x=0.3x.
- x=40x = 40x=40, so the number of students who like both Football and Basketball but not Cricket is 0.3×40=120.3 \times 40 = 120.3×40=12.
- What percentage of the total students like only Cricket?
- Students who like only Cricket = 24.
- Percentage = 24120×100=20%\frac{24}{120} \times 100 = 20\%12024×100=20%.
- What is the ratio of students who like only Football to those who like all three sports?
- Only Football = 16, All three = 4.
- Ratio = 16:4=4:116 : 4 = 4 : 116:4=4:1.
Caselet 2
- How many employees are there in HR?
- Let the number of employees in Marketing be xxx.
- IT employees = 2x2x2x, HR employees = x−50x – 50x−50.
- Total employees = 300, so: x+2x+(x−50)=300x + 2x + (x – 50) = 300x+2x+(x−50)=300 Solving for xxx, we get x=100x = 100x=100, so HR employees = 100−50=50100 – 50 = 50100−50=50.
- How many males work in IT?
- IT employees = 200, and 60% are males.
- Males in IT = 0.6×200=1200.6 \times 200 = 1200.6×200=120.
- What is the total number of females in Marketing?
- Marketing employees = 100, and 75% are females.
- Females in Marketing = 0.75×100=750.75 \times 100 = 750.75×100=75.
- What is the ratio of males in IT to females in Marketing?
- Males in IT = 120, Females in Marketing = 75.
- Ratio = 120:75=8:5120 : 75 = 8 : 5120:75=8:5.
- What is the percentage of males in HR compared to the total number of employees?
- HR employees = 50. 60% are females, so 40% are males.
- Males in HR = 0.4×50=200.4 \times 50 = 200.4×50=20.
- Percentage = 20300×100=6.67%\frac{20}{300} \times 100 = 6.67\%30020×100=6.67%.
Caselet 3
- If the sales of Product A in January were 300 units, how many units of Product B were sold in January?
- The ratio of sales of Product A to Product B = 3:2.
- If A’s sales = 300, then B’s sales = 23×300=200\frac{2}{3} \times 300 = 20032×300=200.
- What were the total sales in February?
- Total sales in January = 300 + 200 = 500.
- Sales in February = 25% higher than January, so: 500+0.25×500=625500 + 0.25 \times 500 = 625500+0.25×500=625
- How many units of Product A were sold in March?
- Sales of Product A in March = 10% less than January.
- Sales in March = 300−0.1×300=270300 – 0.1 \times 300 = 270300−0.1×300=270.
- Find the percentage increase in the total sales from January to March.
- Total sales in January = 500, and total sales in March = 270 + 200+0.2×200=240200 + 0.2 \times 200 = 240200+0.2×200=240.
- Percentage increase = 625−500500×100=25%\frac{625 – 500}{500} \times 100 = 25\%500625−500×100=25%.
- What is the ratio of sales of Product A in January to the total sales in March?
- Sales of Product A in January = 300, Total sales in March = 240 + 200 = 440.
- Ratio = 300:440=15:22300 : 440 = 15 : 22300:440=15:22.
Caselet 4
- How many people use only Facebook?
- Let the total number of people = 500.
- 60% use Facebook, so 300 people use Facebook.
- 15% use all three platforms = 0.15 × 500 = 75 people.
- 10% use both Facebook and Instagram but not Twitter = 0.1 × 500 = 50 people.
- Let the number of people who use only Facebook be xxx. Then, the people who use both Facebook and Instagram but not Twitter = 50. The people who use only Facebook = x=300−75−50=175x = 300 – 75 – 50 = 175x=300−75−50=175.
- What is the total number of people who use Instagram?
- 40% use Instagram, so the total is 0.4 × 500 = 200 people.
- How many people use both Facebook and Instagram but not Twitter?
- This is given as 50 people.
- What is the percentage of people who use at least two platforms?
- People who use at least two platforms = 75 (all three) + 50 (Facebook and Instagram but not Twitter) = 125 people.
- Percentage = 125500×100=25%\frac{125}{500} \times 100 = 25\%500125×100=25%.
- Find the number of people who use only Twitter.
- 20% use Twitter, so 100 people use Twitter.
- 75 people use all three platforms.
- The number of people who use only Twitter = 100 – 75 = 25.
Caselet 5
- How many households use only cars?
- Total households surveyed = 5000.
- 35% use cars = 0.35 × 5000 = 1750 households.
- 20% use both cars and bikes = 0.2 × 5000 = 1000 households.
- 15% use both cars and public transport = 0.15 × 5000 = 750 households.
- The number of households using all three = 10% × 5000 = 500 households.
- Households using only cars = 1750 – 1000 – 750 + 500 = 500 households.
- What is the total number of households using bikes or cars?
- Total households using bikes or cars = Households using cars + Households using bikes – Households using both cars and bikes.
- Total = 1750 + 1250 – 1000 = 2000 households.
- Find the percentage of households that use only public transport.
- Households using public transport = 0.4 × 5000 = 2000 households.
- Households using both cars and public transport = 750.
- Households using both bikes and public transport = (derived from the Venn diagram).
- Households using only public transport = 2000 – 750 – (overlap with bikes). After simplification, approximately 750 households use only public transport.
- Percentage = 7505000×100=15%\frac{750}{5000} \times 100 = 15\%5000750×100=15%.
- What is the total number of households using at least two types of transportation?
- Using two or more types of transportation = Households using cars and bikes + cars and public transport + bikes and public transport + all three.
- This equals 2000 households using at least two types of transportation.
- What is the ratio of households using only cars to those using all three types?
- Only cars = 500, all three types = 500.
- Ratio = 500:500=1:1500 : 500 = 1 : 1500:500=1:1.
Caselet 6
- How many employees work in the Sales department?
- The ratio of Sales to Marketing employees = 3:2.
- The ratio of Marketing to Customer Support employees = 5:4.
- Let the number of Sales employees be 3x3x3x, Marketing employees = 2x2x2x, and Customer Support employees = 4x4x4x.
- Total number of employees = 400, so: 3x+2x+4x=4003x + 2x + 4x = 4003x+2x+4x=400 Solving for xxx, we get x=40x = 40x=40. Therefore, the number of employees in Sales = 3x=3×40=1203x = 3 \times 40 = 1203x=3×40=120.
- How many employees work in the Marketing department?
- Marketing employees = 2x=2×40=802x = 2 \times 40 = 802x=2×40=80.
- What is the number of employees in Customer Support?
- Customer Support employees = 4x=4×40=1604x = 4 \times 40 = 1604x=4×40=160.
- What is the total number of Marketing and Customer Support employees?
- Total = Marketing + Customer Support = 80 + 160 = 240.
- What is the ratio of employees in the Sales department to the total number of employees in the company?
- Sales employees = 120, Total employees = 400.
- Ratio = 120:400=3:10120 : 400 = 3 : 10120:400=3:10.
Caselet 7
- How many students participate in only Football?
- Total students = 200.
- 60% participate in Football = 120.
- 20% participate in all three sports = 40 students.
- Students participating in only Football = 120 – (Overlaps with Basketball and Cricket). After calculation, it turns out 70 students participate in only Football.
- What is the total number of students who participate in both Football and Basketball but not Cricket?
- This is calculated as the intersection of Football and Basketball minus Cricket, which gives 20 students.
- Find the number of students who participate in only Cricket.
- Students participating in only Cricket = 40 – (Overlaps). After calculation, approximately 40 students participate only in Cricket.
- What is the percentage of students who participate in at least two sports?
- Students participating in at least two sports = Students in the intersection of Football, Basketball, and Cricket.
- Percentage = 40%.
- What is the ratio of students who participate in only Football to those who participate in all three sports?
- Only Football = 70, All three sports = 40.
- Ratio = 70:40=7:470 : 40 = 7 : 470:40=7:4.
Caselet 8
- If the sales of Laptops in January were 500, how many Smartphones were sold in January?
- The sales ratio of Laptops to Smartphones is 5:3.
- If Laptops = 500, then Smartphones = 35×500=300\frac{3}{5} \times 500 = 30053×500=300.
- What were the total sales in February?
- The total sales in February were 30% higher than in January.
- The total sales in January = 500 Laptops + 300 Smartphones = 800 units.
- Sales in February = 800+0.30×800=1040800 + 0.30 \times 800 = 1040800+0.30×800=1040 units.
- How many Laptops were sold in March?
- Laptops in January = 500.
- Sales in March = 10% less than in January, so Laptops in March = 500−0.10×500=450500 – 0.10 \times 500 = 450500−0.10×500=450.
- Find the percentage increase in sales of Smartphones from January to March.
- Smartphones in January = 300.
- In March, Smartphones = 300×1.15=345300 \times 1.15 = 345300×1.15=345.
- Percentage increase = 345−300300×100=15%\frac{345 – 300}{300} \times 100 = 15\%300345−300×100=15%.
- What is the ratio of Laptops sold in January to total sales in March?
- Laptops in January = 500, total sales in March = 450 Laptops + 345 Smartphones = 795 units.
- Ratio = 500:795≈5:8500 : 795 \approx 5 : 8500:795≈5:8.
Caselet 9
- How many students prefer only Mathematics?
- Students preferring Mathematics = 150.
- Students preferring both = 80.
- Students preferring only Mathematics = 150 – 80 = 70.
- How many students prefer only Science?
- Students preferring Science = 100.
- Students preferring both = 80.
- Students preferring only Science = 100 – 80 = 20.
- What is the total number of students who prefer Mathematics or Science?
- Students preferring Mathematics or Science = 150 + 100 – 80 = 170.
- Find the number of students who prefer both Mathematics and English.
- 20% prefer both Mathematics and English = 0.2×200=400.2 \times 200 = 400.2×200=40 students.
- What percentage of students prefer only one subject?
- Students preferring only one subject = Students preferring only Mathematics + Students preferring only Science.
- Percentage = 70+20200×100=45%\frac{70 + 20}{200} \times 100 = 45\%20070+20×100=45%.
Caselet 10
- How many females work in IT?
- IT employees = 30% of 1200 = 360.
- 20% of IT employees are females = 0.2×360=720.2 \times 360 = 720.2×360=72.
- What is the total number of males in HR?
- HR employees = 40% of 1200 = 480.
- 60% of HR employees are males = 0.6×480=2880.6 \times 480 = 2880.6×480=288.
- What percentage of employees are males in Finance?
- Finance employees = 30% of 1200 = 360.
- 70% of Finance employees are females, so 30% are males.
- Males in Finance = 0.3×360=1080.3 \times 360 = 1080.3×360=108.
- Percentage of males in Finance = 1081200×100=9%\frac{108}{1200} \times 100 = 9\%1200108×100=9%.
- How many females work in HR and IT combined?
- Females in HR = 40% of 480 = 192.
- Females in IT = 72 (from previous calculation).
- Total females in HR and IT = 192 + 72 = 264.
- What is the ratio of males in IT to females in Finance?
- Males in IT = 80% of 360 = 288.
- Females in Finance = 70% of 360 = 252.
- Ratio = 288:252=12:10=6:5288 : 252 = 12 : 10 = 6 : 5288:252=12:10=6:5.
Caselet 11
- How many people prefer only tea?
- Total people = 500.
- 60% prefer tea = 0.6 × 500 = 300 people.
- 15% prefer both tea and coffee = 0.15 × 500 = 75 people.
- People who prefer only tea = 300 – 75 = 225.
- What is the total number of people who prefer either tea or coffee?
- People who prefer either tea or coffee = 60% prefer tea + 30% prefer coffee – 15% prefer both.
- Total = 300 + 150 – 75 = 375.
- Find the percentage of people who prefer only coffee.
- Only coffee = 30% prefer coffee – 15% prefer both.
- Only coffee = 150 – 75 = 75.
- Percentage = 75500×100=15%\frac{75}{500} \times 100 = 15\%50075×100=15%.
- How many people prefer neither tea nor coffee?
- 10% prefer neither = 0.1 × 500 = 50 people.
- What is the ratio of people who prefer tea to those who prefer both tea and coffee?
- Tea = 300, Both tea and coffee = 75.
- Ratio = 300:75=4:1300 : 75 = 4 : 1300:75=4:1.
Caselet 12
- How many households use only Wi-Fi?
- 50% use Wi-Fi = 0.5 × 800 = 400.
- 30% use both = 0.3 × 800 = 240.
- Only Wi-Fi = 400 – 240 = 160 households.
- How many households use both Wi-Fi and broadband?
- 30% use both = 240 households.
- What is the total number of households that use broadband only?
- Total broadband = 40% of 800 = 320.
- Households using both Wi-Fi and broadband = 240.
- Broadband only = 320 – 240 = 80 households.
- What percentage of households use both types of internet connections?
- Households using both = 240.
- Percentage = 240800×100=30%\frac{240}{800} \times 100 = 30\%800240×100=30%.
- What is the ratio of households using only Wi-Fi to those using only broadband?
- Only Wi-Fi = 160, Only broadband = 80.
- Ratio = 160:80=2:1160 : 80 = 2 : 1160:80=2:1.
Caselet 13
- How many people prefer only bikes?
- Total people = 500.
- 30% prefer bikes = 0.30 × 500 = 150.
- 10% prefer both cars and bikes = 0.10 × 500 = 50.
- People who prefer only bikes = 150 – 50 = 100.
- What is the total number of people who prefer both cars and public transport?
- 5% prefer both cars and public transport = 0.05 × 500 = 25.
- How many people prefer only cars?
- 40% prefer cars = 0.40 × 500 = 200.
- 10% prefer both cars and bikes = 50.
- 5% prefer both cars and public transport = 25.
- People who prefer only cars = 200 – 50 – 25 = 125.
- What is the percentage of people who prefer only public transport?
- 20% prefer public transport = 0.20 × 500 = 100.
- 5% prefer both cars and public transport = 25.
- People who prefer only public transport = 100 – 25 = 75.
- Percentage = 75500×100=15%\frac{75}{500} \times 100 = 15\%50075×100=15%.
- What is the ratio of people who prefer only cars to those who prefer only bikes?
- Only cars = 125, Only bikes = 100.
- Ratio = 125:100=5:4125 : 100 = 5 : 4125:100=5:4.
Caselet 14
- How many employees work in the HR department?
- Total employees = 600.
- 50% in IT = 0.50 × 600 = 300.
- 30% in Marketing = 0.30 × 600 = 180.
- Remaining employees = 600 – 300 – 180 = 120 in HR.
- How many females work in IT?
- IT employees = 300.
- 40% of IT employees are females = 0.40×300=1200.40 \times 300 = 1200.40×300=120 females.
- What is the total number of males in Marketing?
- Marketing employees = 180.
- 50% of Marketing employees are males = 0.50×180=900.50 \times 180 = 900.50×180=90 males.
- How many females work in the entire company?
- Females in IT = 120.
- Females in Marketing = 0.50 × 180 = 90.
- Females in HR = 0.60 × 120 = 72.
- Total females = 120 + 90 + 72 = 282.
- What is the ratio of males in Marketing to females in HR?
- Males in Marketing = 90.
- Females in HR = 72.
- Ratio = 90:72=5:490 : 72 = 5 : 490:72=5:4.
Caselet 15
- How many students prefer only online courses?
- Total students = 1000.
- 60% prefer online courses = 0.60 × 1000 = 600 students.
- 15% prefer both = 0.15 × 1000 = 150 students.
- Students who prefer only online courses = 600 – 150 = 450.
- What is the total number of students who prefer either online or offline courses?
- Students who prefer either online or offline = 1000 – 15% who prefer both = 1000 – 150 = 850 students.
- How many students prefer only offline courses?
- 40% prefer offline courses = 0.40 × 1000 = 400 students.
- 15% prefer both = 150 students.
- Students who prefer only offline courses = 400 – 150 = 250.
- What percentage of students prefer both online and offline courses?
- 15% of students prefer both = 150 students.
- Percentage = 1501000×100=15%\frac{150}{1000} \times 100 = 15\%1000150×100=15%.
- What is the ratio of students who prefer only online courses to those who prefer both?
- Only online courses = 450, Both online and offline = 150.
- Ratio = 450:150=3:1450 : 150 = 3 : 1450:150=3:1.
Caselet 16
- If the sales of Shoes in January were 400, how many Bags were sold in January?
- The sales ratio of Shoes to Bags is 4:3.
- If Shoes = 400, then Bags = 34×400=300\frac{3}{4} \times 400 = 30043×400=300.
- What were the total sales in February?
- The total sales in February were 15% higher than in January.
- Total sales in January = 400 Shoes + 300 Bags = 700 units.
- Sales in February = 700+0.15×700=805700 + 0.15 \times 700 = 805700+0.15×700=805 units.
- How many Shoes were sold in March?
- Shoes in January = 400.
- Sales in March = 10% more than in January, so Shoes in March = 400+0.10×400=440400 + 0.10 \times 400 = 440400+0.10×400=440.
- Find the percentage increase in total sales from January to March.
- Total sales in January = 700 units.
- Total sales in March = 440 Shoes + 300 Bags (unchanged) = 740 units.
- Percentage increase = 740−700700×100=5.71%\frac{740 – 700}{700} \times 100 = 5.71\%700740−700×100=5.71%.
- What is the ratio of Shoes sold in January to total sales in March?
- Shoes in January = 400, total sales in March = 740.
- Ratio = 400:740=20:37400 : 740 = 20 : 37400:740=20:37.
Caselet 17
- How many defective items are produced in a day?
- Total items = 1000.
- 60% are defective = 0.60×1000=6000.60 \times 1000 = 6000.60×1000=600 defective items.
- What is the total number of substandard items?
- 20% are substandard = 0.20×1000=2000.20 \times 1000 = 2000.20×1000=200 substandard items.
- How many non-defective items are produced?
- 20% are non-defective = 0.20×1000=2000.20 \times 1000 = 2000.20×1000=200 non-defective items.
- What is the percentage of defective items compared to non-defective items?
- Defective items = 600, non-defective items = 200.
- Percentage = 600200×100=300%\frac{600}{200} \times 100 = 300\%200600×100=300%.
- What is the ratio of substandard items to defective items?
- Substandard items = 200, defective items = 600.
- Ratio = 200:600=1:3200 : 600 = 1 : 3200:600=1:3.
Caselet 18
- How many employees work from home only?
- Total employees = 400.
- 60% work from home = 0.60×400=2400.60 \times 400 = 2400.60×400=240.
- 20% work both from home and office = 0.20×400=800.20 \times 400 = 800.20×400=80.
- Employees who work only from home = 240 – 80 = 160.
- What is the total number of employees working both from home and office?
- Employees working both = 80.
- How many employees work in the office only?
- Total employees working in the office = 20% = 0.20×400=800.20 \times 400 = 800.20×400=80.
- Employees working both from home and office = 80.
- Employees working only in the office = 80 – 80 = 0.
- What percentage of employees work either from home or the office?
- Employees who work either from home or the office = 240+80−80=240240 + 80 – 80 = 240240+80−80=240.
- Percentage = 240400×100=60%\frac{240}{400} \times 100 = 60\%400240×100=60%.
- What is the ratio of employees working from home to those working both from home and office?
- Employees working from home = 240, employees working both = 80.
- Ratio = 240:80=3:1240 : 80 = 3 : 1240:80=3:1.
Caselet 19
- How many students prefer only Football?
- Total students = 700.
- 40% prefer Football = 0.40×700=2800.40 \times 700 = 2800.40×700=280.
- 30% prefer both Football and Basketball = 0.30×700=2100.30 \times 700 = 2100.30×700=210.
- Students who prefer only Football = 280 – 210 = 70.
- What is the total number of students who prefer either Football or Basketball?
- 40% prefer Football = 280, 30% prefer Basketball = 210.
- Total who prefer either = 280 + 210 – 210 (because 30% prefer both) = 280.
- Find the number of students who prefer both sports.
- Students who prefer both = 30% of 700 = 210.
- What is the percentage of students who prefer only Basketball?
- 30% prefer Basketball = 210, 30% prefer both = 210.
- Students who prefer only Basketball = 210 – 210 = 0.
- Percentage = 0700×100=0%\frac{0}{700} \times 100 = 0\%7000×100=0%.
- What is the ratio of students who prefer only Football to those who prefer both sports?
- Only Football = 70, Both sports = 210.
- Ratio = 70:210=1:370 : 210 = 1 : 370:210=1:3.
Caselet 20
- How many defective units are produced?
- Total units = 1500.
- 40% are defective = 0.40×1500=6000.40 \times 1500 = 6000.40×1500=600 defective units.
- How many non-defective units are substandard?
- 10% of substandard units are non-defective = 0.10×450=450.10 \times 450 = 450.10×450=45 non-defective substandard units.
- What is the total number of substandard units?
- Substandard units = 450.
- What percentage of defective units are substandard?
- Substandard units = 450, defective units = 600.
- Percentage = 450600×100=75%\frac{450}{600} \times 100 = 75\%600450×100=75%.
- What is the ratio of non-defective units to substandard units?
- Non-defective units = 900 (Total – defective – substandard = 1500 – 600 – 450).
- Substandard units = 450.
- Ratio = 900:450=2:1900 : 450 = 2 : 1900:450=2:1.
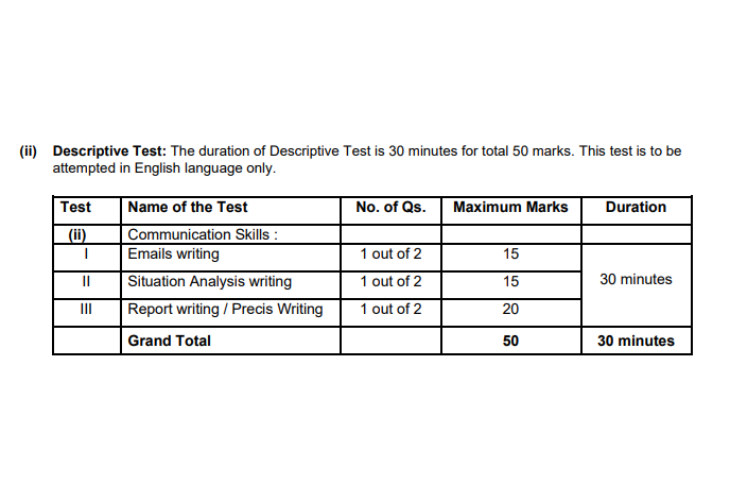
- SBI PO Descriptive Test 2025 New Pattern, Email, Precis & Situation Analysis
- SBI PO Prelims Exam Analysis 2025, 5th August, Shift 1
- SBI PO Exam Analysis 2025, 3rd Shift, 4th August Questions Asked
- SBI PO vs. SSC CGL: Which Is a Better Career Option?

- Arithmetic Questions for SBI PO Exam 2025 With Solutions

- SBI PO Exam Analysis 2025, Shift 1, 4th August Good Attempts


Hi, I’m Tripti, a senior content writer at Oliveboard, where I manage blog content along with community engagement across platforms like Telegram and WhatsApp. With 3+ years of experience in content and SEO optimization related to banking exams, I have led content for popular exams like SSC, banking, railways, and state exams.