In this blog, we will understand the Theory of Demand and Supply, which is a very important topic in Economics. This topic helps you understand how markets work and how prices are determined. If your basics are clear, you can easily solve related questions in the exam.
What is Demand and Supply?
Demand and Supply form the foundation of any market economy. They explain how buyers and sellers interact and how prices are decided. This topic is frequently asked in SSC Exams like SSC CGL, CHSL, and MTS.
| Concept | Meaning |
| Demand | Quantity of goods or services that consumers are willing to buy at a given price. |
| Supply | Quantity of goods or services that producers are willing to sell at a given price. |
Demand and Supply Relationship
Before going into laws, it’s important to understand how price affects demand and supply.
| Relationship | Explanation |
| Demand Relationship | Shows how price and quantity demanded are related (inverse relation). |
| Supply Relationship | Shows how price and quantity supplied are related (direct relation). |
In simple terms, price is the key factor that connects demand and supply in the market.
Law of Demand
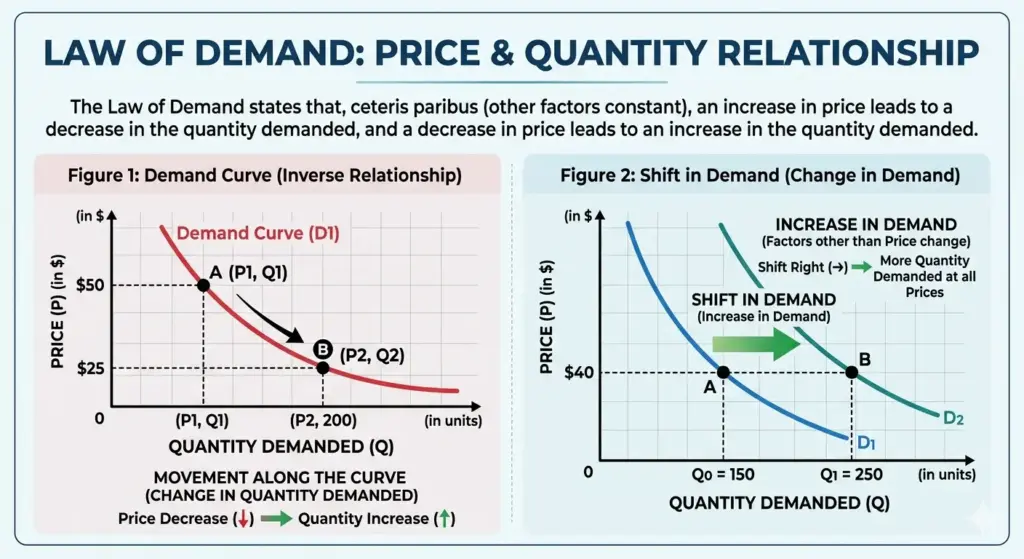
The Law of Demand states that when the price of a good increases, its demand decreases, and when the price decreases, demand increases (keeping other factors constant). Key points of Law of Demand are
- Price ↑ → Demand ↓
- Price ↓ → Demand ↑
- Inverse relationship between price and demand
Demand Curve
The demand curve is a graphical representation of this relationship.
| Feature | Description |
| Axis | Price on Y-axis, Quantity on X-axis |
| Shape | Downward sloping (left to right) |
| Reason | Inverse relationship between price and demand |
Law of Supply
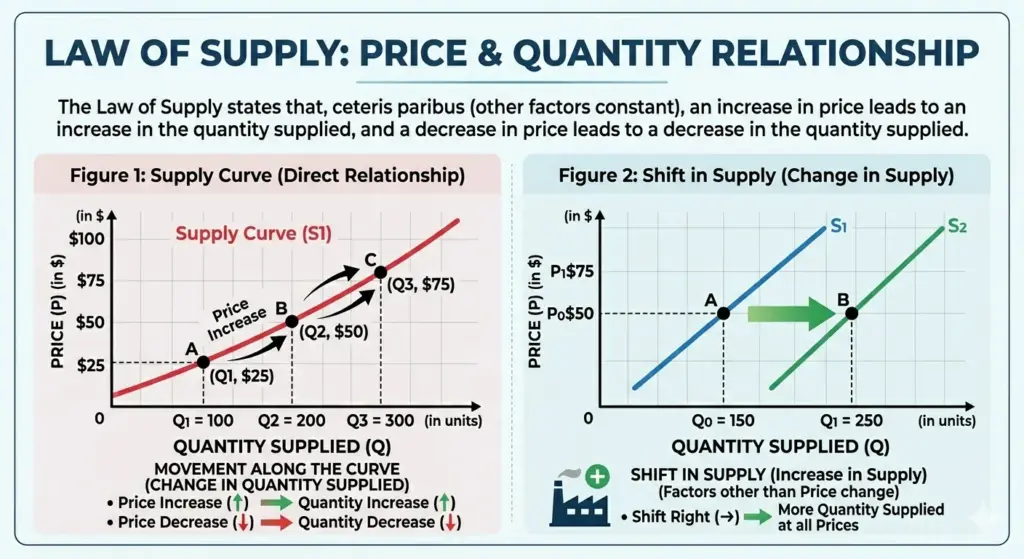
The Law of Supply states that when the price of a good increases, its supply also increases, and when the price decreases, supply decreases. Key points of Law of Supply are:
- Price ↑ → Supply ↑
- Price ↓ → Supply ↓
- Direct relationship between price and supply
Supply Curve
The supply curve shows how supply changes with price.
| Feature | Description |
| Axis | Price on Y-axis, Quantity on X-axis |
| Shape | Upward sloping (left to right) |
| Reason | Direct relationship between price and supply |
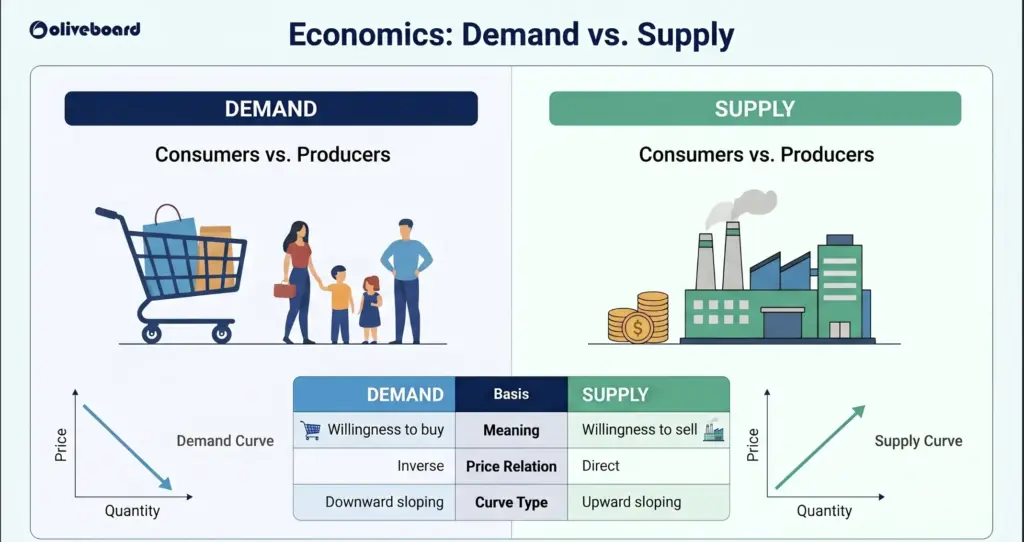
Demand vs Supply
Quick comparison is given below:
| Basis | Demand | Supply |
| Meaning | Willingness to buy | Willingness to sell |
| Relation with Price | Inverse | Direct |
| Curve | Downward sloping | Upward sloping |
| Controlled by | Consumers | Producers |
Market Equilibrium
When demand and supply are equal (i.e. when the demand function and supply function intersect) the economy is said to be at equilibrium. At this intersection point, the allocation of goods is at its most efficient state because the amount of goods being supplied is the same as the amount of goods being demanded. Thus, everyone i.e. individuals, firms, or countries, is satisfied with the current economic condition. At the given price, suppliers are selling all the goods that they produced, and consumers are getting all the goods that they demanded. Market equilibrium is the point where demand equals supply. Key points of equilibrium are:
- Demand = Supply
- No shortage or surplus
- Market is stable
- Efficient allocation of resources
| Condition | Result |
| Demand > Supply | Shortage (Price increases) |
| Supply > Demand | Surplus (Price decreases) |
| Demand = Supply | Equilibrium |
Role of Time in Supply
Time plays an important role in supply because producers cannot always respond instantly to price changes.
- Short-term: Supply changes slowly
- Long-term: Supply adjusts fully
- Helps determine whether price change is temporary or permanent

Hello there! I’m a dedicated Government Job aspirant turned passionate writer & content marketer. My blogs are a one-stop destination for accurate and comprehensive information on exam categories like Regulatory Bodies, Banking, SSC, State PSCs, and more. I am on a mission to provide you with all the details you need, conveniently in one place. When I am not writing and marketing, you will find me happily experimenting in the kitchen, cooking up delightful treats. Join me on this journey of knowledge and flavors!