What does the Global Hunger Index capture?
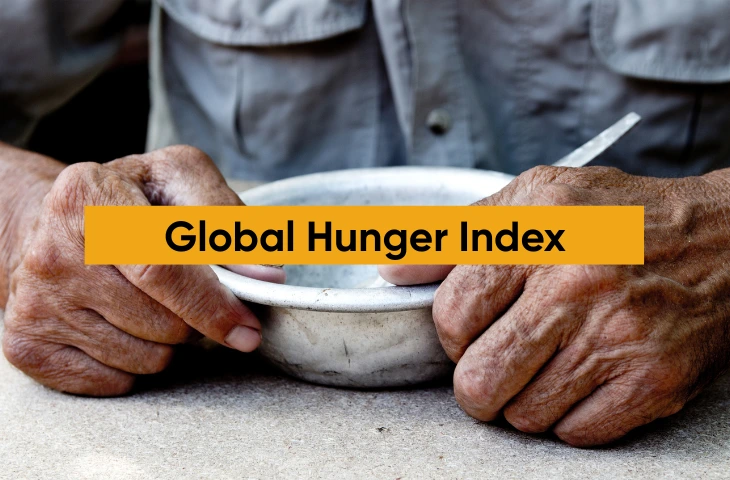
The Global Hunger Index (GHI) is an annual, peer-reviewed tool that measures hunger at global, regional, and national levels. It combines four key indicators into a single score:
- Undernourishment – percentage of the population with insufficient caloric intake
- Child stunting – percentage of children under five with low height-for-age (chronic undernutrition)
- Child wasting – percentage of children under five with low weight-for-height (acute undernutrition)
- Child mortality – under-five mortality rate, reflecting nutrition-related deaths
Each country is ranked on a 0–100 scale, where a higher score indicates worse hunger outcomes. The index also categorizes hunger levels as low, moderate, serious, alarming, or extremely alarming.
| GHI Score | Category |
| ≤ 9.9 | Low |
| 10–19.9 | Moderate |
| 20–34.9 | Serious |
| 35–49.9 | Alarming |
| ≥ 50 | Extremely alarming |
How to Calculate GHI Score?
Calculation involves four main steps:
| Step | Description |
| Source Data | Indicators are taken from trusted international datasets: FAO → Undernourishment, UNICEF/WHO → Child stunting & wasting, UN IGME → Child mortality |
| Standardize/Normalize | Values are adjusted so they are comparable across countries and over time. |
| Combine Indicators | The four indicators are aggregated using a defined formula to produce a 0–100 GHI score. |
| Rank Countries | Countries with adequate data are ranked. (Where data is missing, countries may not be ranked for that year.) |
Note: The 2015 methodology revision (better measurement of stunting and wasting) makes comparisons across long time spans more reliable.
Global progress & evolving focus (2006 to 2024)
GHI reports have shown an uneven journey over the years:
- 2006–2011: Focus on macro shocks such as the 2009 financial crisis and 2011 global food price spikes.
- Mid-2010s: Greater attention to nutrition quality and links with the Sustainable Development Goals (SDGs).
- 2015: Introduction of a major methodology update (better treatment of stunting and wasting).
- Late 2010s–early 2020s: Spotlight on forced migration, climate risk, conflict, pandemics, and governance as key drivers of hunger.
- 2023–2024: Emphasis on youth, gender justice, and climate resilience as central levers for reducing hunger.
Key fact: The 2024 Global Hunger Index average score is 18.3 (moderate), showing slow global progress and persistent regional disparities.
| Year | Theme | PDF Link |
| 2006 | Hunger & Malnutrition: Global Trends (baseline report) | Download |
| 2007 | Scaling Up Hunger Reduction | Download |
| 2008 | Rising Food Prices & Hunger | Download |
| 2009 | Financial Crisis & Hunger Vulnerabilities | Download |
| 2010 | Early Childhood Undernutrition | Download |
| 2011 | High & Volatile Food Prices | Download |
| 2012 | Land, Water, Energy Stresses | Download |
| 2013 | Resilience for Food & Nutrition Security | Download |
| 2014 | Hidden Hunger (Micronutrients) | Download |
| 2015 | Armed Conflict & Hunger | Download |
| 2016 | SDGs & Zero Hunger | Download |
| 2017 | Inequality, Power & Hunger | Download |
| 2018 | Forced Migration & Hunger | Download |
| 2019 | Climate Change as Hunger Multiplier | Download |
| 2020 | One Health & Zero Hunger | Download |
| 2021 | Hunger & Conflict | Download |
| 2022 | Food Systems & Local Governance | Download |
| 2023 | Youth & Food Sovereignty | Download |
| 2024 | Gender, Climate & Resilience | Download |
Highlights of GHI Report (2006 to 2024)
Here are the key highlights from the Global Hunger Index (GHI) reports between 2006 and 2024, showing trends and progress in tackling hunger worldwide:
2006 – Baseline Report
The first GHI established a composite index combining undernourishment, child mortality, and child malnutrition. It highlighted South Asia and Sub-Saharan Africa as hotspots of hunger. The report created a benchmark to track hunger trends systematically. Exam value: 2006 = baseline year for GHI.
2007 – Scaling Up Hunger Reduction
Focused on successful country examples of reducing hunger through integrated programs. It emphasized agricultural growth, nutrition interventions, and policy support. Highlighted that hunger reduction requires scaling proven models. Exam value: shows early link between programs and outcomes.
2008 – Rising Food Prices & Hunger
Analyzed the global food price spike of 2007–08 and its impact on access to food. Showed how poor households were disproportionately hit due to high dependency on food purchases. Called for stronger safety nets. Exam value: food inflation–nutrition connection.
2009 – Financial Crisis & Hunger Vulnerabilities
Linked the global financial downturn to rising poverty and hunger. Stressed how economic crises amplify existing food insecurity. Recommended social protection and safety nets as buffers. Exam value: economic shocks + hunger.
2010 – Early Childhood Undernutrition
Emphasized the first 1,000 days (conception–2 years) as critical for preventing stunting. Undernutrition in early childhood was linked to poor health, education, and productivity later. Called for maternal nutrition and infant feeding interventions. Exam value: child nutrition + 1,000 days concept.
2011 – High & Volatile Food Prices
Explored how food price volatility undermines food access, stability, and nutrition. It showed links between global commodity speculation, climate events, and hunger. Recommended price stabilization and targeted policies. Exam value: connects economics with hunger.
2012 – Land, Water & Energy Stresses
Highlighted how competition for natural resources undermines food security. Stressed sustainable management of land, water, and energy for agriculture. Called for climate-smart policies. Exam value: environment–hunger nexus.
2013 – Resilience for Food & Nutrition Security
Discussed resilience-building in food systems to withstand economic, political, and environmental shocks. Recommended community-based safety nets and adaptive governance. Exam value: resilience concept for GS3 essays.
2014 – Hidden Hunger (Micronutrient Deficiency)
Exposed “hidden hunger” — deficiencies in vitamins and minerals despite adequate calories. Linked hidden hunger to poor cognitive development and productivity losses. Stressed dietary diversification and fortification. Exam value: hidden hunger definition + solutions.
2015 – Armed Conflict & Hunger
Showed how wars and instability directly disrupt food access, agriculture, and nutrition services. Highlighted Syria, South Sudan, and Yemen as case studies. Positioned conflict as a major driver of global hunger. Exam value: conflict–hunger nexus.
2016 – SDGs & Zero Hunger
Connected hunger reduction directly to SDG 2 (Zero Hunger). Showed the importance of integrated policies across agriculture, nutrition, and social protection. Placed hunger at the center of the 2030 Agenda. Exam value: SDG 2 framing.
2017 – Inequality & Power in Hunger Reduction
Focused on inequality as a barrier to ending hunger. Showed how unequal access to land, income, and resources limits progress. Linked gender inequality to persistent undernutrition. Exam value: inequality as structural driver.
2018 – Forced Migration & Hunger
Highlighted hunger in refugee and conflict-driven migration contexts. Stressed how displacement worsens food insecurity and dependence on aid. Recommended global cooperation on food support. Exam value: migration–food security link.
2019 – Climate Change as Hunger Multiplier
Explored how climate change exacerbates hunger through extreme weather, yield losses, and nutrient depletion. Warned that climate risks disproportionately affect vulnerable populations. Recommended climate adaptation in agriculture. Exam value: climate–hunger multiplier concept.
2020 – One Health & Zero Hunger
Connected food security with human, animal, and environmental health. COVID-19 underscored interlinkages between disease outbreaks and food systems. Called for “One Health” approaches to hunger reduction. Exam value: pandemic + One Health framework.
2021 – Hunger in Conflict Settings
Analyzed how conflict zones like Yemen, Syria, and Sahel face worsening hunger. Showed how violence destroys crops, markets, and aid delivery. Reinforced hunger as both a cause and consequence of conflict. Exam value: conflict case studies.
2022 – Food Systems & Local Governance
Shifted focus to systemic transformation of food systems. Emphasized role of local governance and participation in achieving sustainable food security. Highlighted bottom-up approaches. Exam value: local governance in food systems.
2023 – Youth & Food Sovereignty
Showed how youth engagement is vital for reshaping food systems. Linked food sovereignty to empowerment, sustainability, and innovation. Called for youth participation in policymaking. Exam value: youth angle in food policy.
2024 – Gender Equality, Climate & Resilience
Highlighted how gender inequality worsens hunger vulnerabilities. Showed that empowering women enhances resilience and climate adaptation. Stressed integrated strategies linking gender justice, climate action, and food security. Exam value: gender–climate–hunger linkage.
Check out All Important Reports for RBI Grade B Exam
Drivers behind GHI fluctuations
Countries’ GHI scores move because of a mix of structural and shock factors. Some of these factors are:
- Conflict & displacement → sudden spikes in wasting and child mortality (acute deterioration).
- Food price shocks & macro crises → immediate increases in undernourishment and food insecurity.
- Climate risks (droughts, floods) → repeated production losses and chronic vulnerability (2019 focus).
- Health system disruptions / pandemics → service lapses that worsen child nutrition (2020 One Health theme).
- Policy & governance (social protection, nutrition programs) → sustained reductions in stunting and undernourishment when well-implemented (examples: school meals, maternal nutrition programs, targeted transfers).
India’s GHI Score
India’s 2024 GHI score is 27.3, ranking 105th among ranked countries in the serious category. India’s component indicators (undernourishment, stunting, wasting, child mortality) reflect a mix of long-term structural problems and policy progress; explaining year-on-year movements requires attention to measurement windows and methodology changes. India’s scores are officially comparable only for the benchmark years: 2000, 2008, 2016, 2024.
| Year | India’s GHI Score | Category | Rank |
| 2000 | 38.4 | Alarming | – |
| 2008 | 35.2 | Alarming | – |
| 2016 | 29.3 | Serious | – |
| 2024 | 27.3 | Serious | 105 |
FAQs
The GHI is an annual index that measures hunger at global, regional, and national levels by combining four indicators – undernourishment, child stunting, child wasting, and child mortality – into a single score.
The GHI is jointly published by Concern Worldwide and Welthungerhilfe, two international NGOs working on food security and hunger eradication.
The GHI is released once every year, usually in October, with updated scores, rankings, and a thematic focus report.
No. GHI scores are only comparable for the benchmark years (2000, 2008, 2016, 2024) due to methodology revisions. Comparisons outside these benchmark years may be misleading.
India’s GHI score is 27.3, placing it in the serious category and ranking 105th among countries assessed.
The GHI connects hunger with broader issues like food security, climate change, governance, conflict, and social inequality. It is useful for UPSC, RBI Grade B, and other competitive exams for current affairs and essay writing.
- SEBI Grade A Exam Analysis 2026, 10th January Good Attempts

- RBI Grade B, SSC CGL, RRB Group D Salary After 8th Pay Commission

- SEBI Grade A Phase 1 Information Handout 2025-26, Download PDF

- SEBI Grade A Shift Timings 2026, Phase 1 Reporting & Exam Time

- Government Schemes for NABARD Grade A 2026

- NABARD Grade A Descriptive Writing Preparation 2026, Check Guide


Priti Palit, is an accomplished edtech writer with 4+ years of experience in Regulatory Exams and other multiple government exams. With a passion for education and a keen eye for detail, she has contributed significantly to the field of online learning. Priti’s expertise and dedication continue to empower aspiring individuals in their pursuit of success in government examinations.
