
What is Data Interpretation?
Data Interpretation (DI) is a crucial section in bank exams like IBPS PO, IBPS Clerk, SBI PO, and other government exams. This section tests a candidate’s ability to quickly analyze and draw conclusions from numerical data presented in tables, bar graphs, pie charts, and line graphs. Strong skills in calculation, logical reasoning, and data analysis are essential to solve data interpretation questions accurately and within time. Mastering DI can significantly boost your overall score in competitive exams.
Data Interpretation Examples / Types
Data Interpretation is of different forms and we have mentioned below the examples of the data interpretation for the candidates.
Table Interpretation: The following table displays the company’s sales figures over the last five years. Your task is to calculate the average yearly sales and identify the year with the highest sales performance.
| Year | Sales (In Million) |
| 2017 | 10 |
| 2018 | 12 |
| 2019 | 15 |
| 2020 | 11 |
| 2021 | 13 |
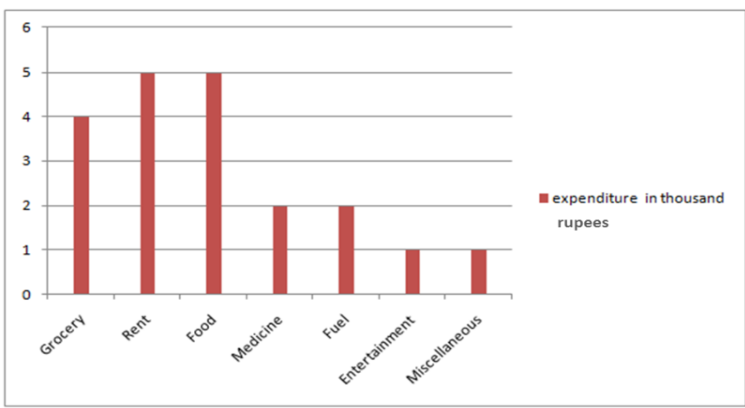
Bar Graph Interpretation: The bar graph displays the monthly expenditure (in thousands) of a household for various categories. Determine the month with the highest expenditure and calculate the total expenditure for the year.
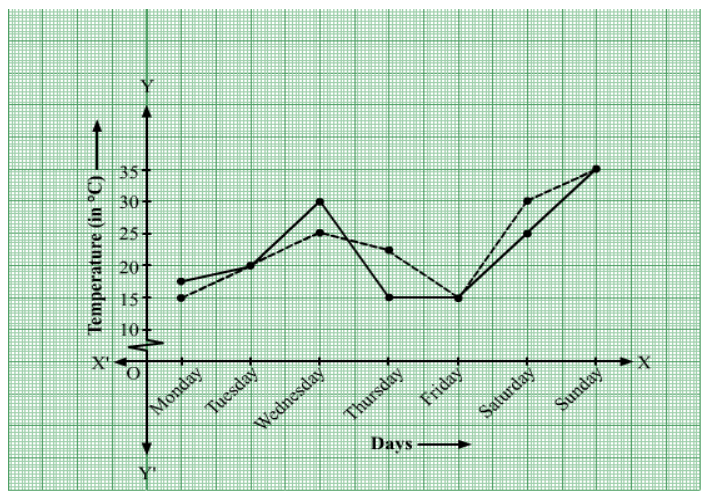
Line Graph Interpretation: The line graph represents the temperature fluctuations (in degrees Celsius) in a city over a week. Identify the day with the lowest temperature and calculate the average temperature during this period.
Data Interpretation Methods
Data interpretation means understanding and explaining the meaning of numbers or data.
When we first collect data, it’s usually in a raw form that’s hard to understand. So, we organize it in a clear way so others can easily get the meaning.
There are two main methods to understand data:
- Qualitative Method
- Quantitative Method
Qualitative Method
This method is used for the analysis of qualitative data, which is called categorical data. In this method, the text is used instead of numbers or patterns for the representation of the data.
This data first needs to be coded into numbers. This coding is also documented as it will help others in the future. Qualitative data are of two types ordinal and nominal. Both of the data types are performed using the same method. However, the interpretation of ordinal data is easier in comparison to nominal data.
Qualitative Method
This method is used to understand categorical data, which is data in the form of words, not numbers. In this method, we use text to explain the data. Before analyzing it, we often convert the text into numbers. This process is called coding, and it should be recorded properly so that others can understand it later.
Qualitative data can be of two types: ordinal and nominal. Both types are analyzed in the same way, but it is usually easier to understand ordinal data than nominal data.
Quantitative Method
This method is used to understand numerical data, which means data made up of numbers. This type of data is easier to work with because it can be directly analyzed using numbers. There are two main types of numerical data: continuous and discrete. Continuous data can also be divided into two types: interval and ratio data.
In this method, there is no need for coding. Instead, we use mathematical tools like mean, median, mode, and standard deviation to understand the data.
Data Interpretation Formulas
In exams like banking tests, solving data interpretation questions often needs clear thinking and simple math skills. Here are some useful formulas:
- Average = (Total of all values) ÷ (Number of values)
- Percentage = (Part ÷ Whole) × 100
- Profit/Loss:
- Profit = Selling Price − Cost Price
- Loss = Cost Price − Selling Price
- Profit or Loss % = (Profit or Loss ÷ Cost Price) × 100
- Simple Interest = (Principal × Rate × Time) ÷ 100
- Compound Interest = Principal × [(1 + Rate/100) ^ Time] − Principal
- Ratio and Proportion: If two values are in the ratio a:b, they can be written as a:b or a/b
- Percentile = (Number of values below a certain value ÷ Total number of values) × 100
Data Interpretation Questions
These questions test your ability to understand and evaluate data using given rules and conditions. Carefully analyze the information before selecting the most logical answer.
Directions (Q1 – Q10):
Directions (Q1 – Q10):
Read the information carefully and answer the following questions:
Mr. Z is designing the lighting for ten different sections of his showroom. He has seven lighting styles to choose from:
- Soft Aura
- Glitter Beam
- Earth Ray
- Velvet Prism
- Metal Gleam
- Platinum Flare
- Ocean Hue
He may use the same type of light in more than one section. The selection must follow these design rules:
- If any section uses Velvet Prism, then no section uses Platinum Flare.
- If any section uses Earth Ray, then no section uses Glitter Beam.
- If any section uses Earth Ray, then at least one section must use Platinum Flare.
- If any section uses Glitter Beam, then at least one section must use Ocean Hue.
- If any section uses Ocean Hue, then at least one section must use Platinum Flare.
- If Platinum Flare is used, it must appear in at least two sections.
Q1.
Which of the following could be a valid set of lighting arrangements (counts are illustrative)?
A) One section with Earth Ray, one with Soft Aura, two with Platinum Flare
B) One section with Velvet Prism, one with Platinum Flare, two with Glitter Beam
C) Two sections with Earth Ray, one with Glitter Beam, one with Ocean Hue
D) One section with Glitter Beam, one with Velvet Prism, one with Platinum Flare
Answer: A
Explanation: Earth Ray requires Platinum Flare (present), and no conflicting styles are used together.
Q2.
If none of the sections used Platinum Flare, what is the maximum number of different lighting types that could have been used?
A) Two
B) Three
C) Four
D) Five
Answer: B
Explanation: Without Platinum Flare, Earth Ray and Ocean Hue cannot be used (each needs a Platinum Flare). Glitter Beam also cannot be used, because it would require Ocean Hue (which in turn requires Platinum Flare). That leaves Soft Aura, Velvet Prism, and Metal Gleam—three types.
Q3.
Which of the following statements is definitely false?
A) Mr. Z used exactly four types of lights, one of which was “Candle Glow”
B) Mr. Z used three types of lights, including Platinum Flare
C) Mr. Z used five types of lights, including Glitter Beam
D) None of these
Answer: A
Explanation: “Candle Glow” is not among the listed lighting styles, making statement A impossible.
Q4.
If Mr. Z aimed to use the maximum number of different lighting types, which one of the following lights could not be part of the selection?
A) Velvet Prism
B) Ocean Hue
C) Metal Gleam
D) Earth Ray
Answer: A
Explanation: Including Velvet Prism would forbid Platinum Flare, but Platinum Flare is needed for several other styles. Excluding Velvet Prism allows more total variety.
Q5.
Assuming Mr. Z used at least one lighting type, what could be the minimum and maximum number of different lighting types used?
A) 1 and 4
B) 1 and 5
C) 1 and 6
D) 2 and 5
Answer: B
Explanation: The minimum is one (use the same style across all sections). The maximum is five, arranging styles without violating any rule (e.g., exclude Velvet Prism to include the other five).
Q6.
Which of the following combinations violates the given rules?
A) One section with Earth Ray, one with Platinum Flare, one with Glitter Beam
B) One section with Velvet Prism, one with Soft Aura
C) Two sections with Ocean Hue, two with Platinum Flare
D) One section with Glitter Beam, one with Ocean Hue, one with Platinum Flare
Answer: A
Explanation: Earth Ray and Glitter Beam cannot be used together (Rule 2).
Q7.
If Velvet Prism is used, which of the following lighting types must not be used?
A) Metal Gleam
B) Platinum Flare
C) Ocean Hue
D) Soft Aura
Answer: B
Explanation: Velvet Prism and Platinum Flare cannot coexist by Rule 1.
Q8.
Mr. Z uses only Glitter Beam, Ocean Hue, and Platinum Flare. How many rules are triggered by this combination?
A) One
B) Two
C) Three
D) Four
Answer: C
Explanation:
- Glitter Beam ⇒ requires Ocean Hue (Rule 4).
- Ocean Hue ⇒ requires Platinum Flare (Rule 5).
- Platinum Flare ⇒ must appear at least twice (Rule 6).
Q9.
What is the minimum number of distinct lighting types Mr. Z can use if he wants to include at least one section of Glitter Beam?
A) Two
B) Three
C) Four
D) Five
Answer: B
Explanation: Glitter Beam forces Ocean Hue (Rule 4), which in turn forces Platinum Flare (Rule 5). Platinum Flare must appear at least twice (Rule 6). Thus at minimum he uses Glitter Beam, Ocean Hue, and Platinum Flare—three distinct types.
Q10.
Mr. Z decides to use exactly five distinct lighting types and wants to include Platinum Flare. Which of these five-light sets is definitely invalid?
A) Soft Aura, Metal Gleam, Platinum Flare, Velvet Prism, Ocean Hue
B) Soft Aura, Glitter Beam, Ocean Hue, Platinum Flare, Earth Ray
C) Velvet Prism, Platinum Flare, Metal Gleam, Soft Aura, Glitter Beam
D) Metal Gleam, Ocean Hue, Platinum Flare, Earth Ray, Glitter Beam
Answer: C
Explanation: In (C), Velvet Prism and Platinum Flare are both included, but Rule 1 prohibits using Velvet Prism if Platinum Flare is used.
Data Interpretation – Frequently Asked Questions
Ans. It involves analyzing data presented in charts, tables, or logic-based conditions to answer related questions accurately.
Ans. Questions can include percentages, averages, ratios, logical deductions, and condition-based reasoning.
Ans. No, it can include logical reasoning with conditions, as well as data-based puzzles with rules.
Ans. Practice regularly with charts, graphs, and logical sets. Focus on accuracy and time management.
Ans. Yes, knowing key formulas (like percentage, average, and ratio) helps solve questions faster and more efficiently.
- SSC CGL Reasoning Questions, Attempt Live & Download Free E-book
- CAIIB BFM Exam Analysis 2026, 7th June Difficulty Level
- CAIIB ABM Exam Analysis 2026, 31st May All Shifts Analysis
- JAIIB 2026 Previous Year Papers, Download Free PDF
- SSC CGL Tier 1 Shift Timings 2026, Check Reporting Time
- SSC CGL 2025 Tier 1 Detailed Shift Analysis Report

Hello, I’m a content writer working at Oliveboard. I focus on creating blogs, articles, and educational content that’s simple, clear, and saves time for readers. I believe in writing that adds real value without overcomplicating things. I also have strong knowledge of banking and government exams, which helps me create content that is both accurate and easy to understand. With experience and consistency, I aim to make preparation smoother for every learner.