
In the SSC CGL Tier 2 for SSC JSO paper, Correlation and Regression is an important topic under Statistics. These concepts help to understand the relationship between two or more variables, how one variable changes when another changes.
1. What is Correlation?
Definition
Correlation measures the degree and direction of relationship between two variables. If two variables change together either in the same or opposite direction they are said to be correlated.
| Type of Correlation | Direction | Example |
| Positive Correlation | Both variables move in the same direction. | Height and Weight – as height increases, weight increases. |
| Negative Correlation | Variables move in opposite directions. | Price and Demand – as price increases, demand decreases. |
| Zero Correlation | No relationship between variables. | Shoe size and intelligence. |
Also check out Most Repeated Quantitative Aptitude Questions for SSC CGL Tier 2
2. Methods to Study Correlation
(a) Scatter Diagram (Graphical Method)
- It is a simple visual method to show correlation between two variables.
- Values of one variable are plotted on the X-axis and the other on the Y-axis.
| Pattern | Type of Correlation | Diagram Description |
| Points lie close to an upward-sloping straight line | Positive Correlation | Both variables increase together |
| Points lie close to a downward-sloping straight line | Negative Correlation | One increases, the other decreases |
| Points scattered randomly | No Correlation | No visible relationship |
(b) Karl Pearson’s Coefficient of Correlation (r)
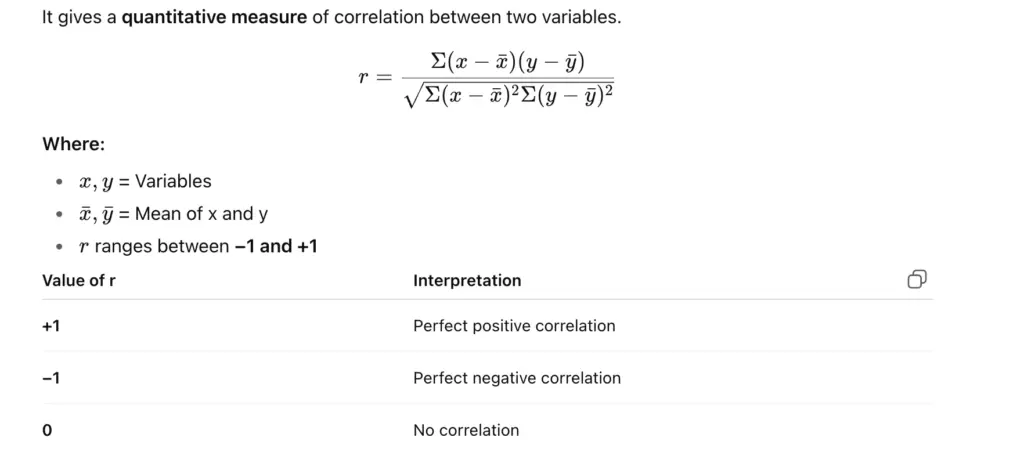
The closer |r| is to 1, the stronger the relationship.
Also check out Most Repeated Quantitative Aptitude Questions for SSC CGL Tier 2
(c) Spearman’s Rank Correlation (rₛ)
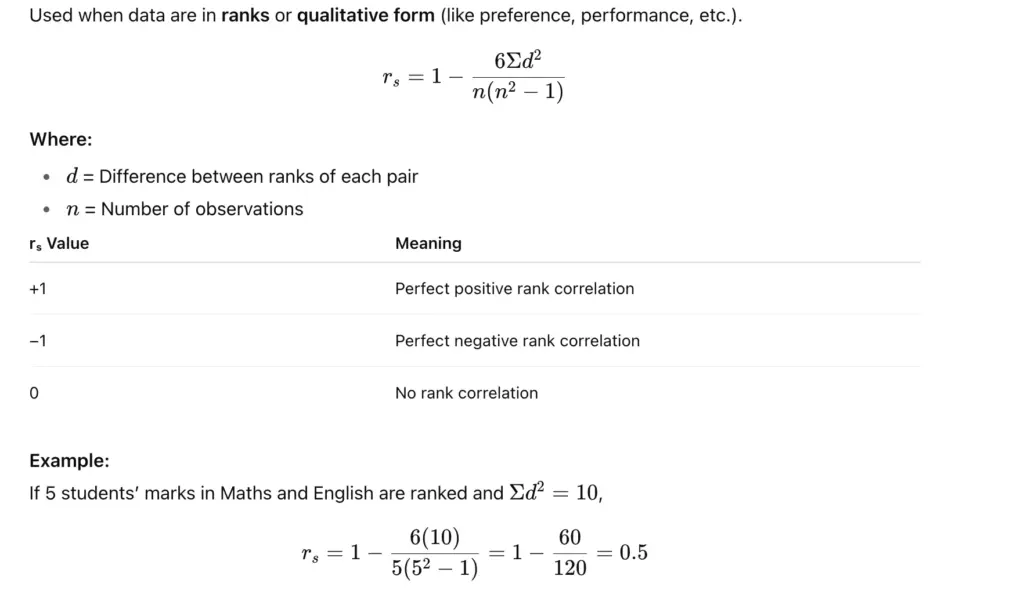
→ Moderate positive correlation.
Check out Most Repeated Reasoning Questions for SSC CGL Tier 2
3. What is Regression?
Definition
Regression shows the functional relationship between two variables, it helps predict the value of one variable based on another.
| Concept | Explanation |
| Dependent Variable (Y) | The variable to be predicted |
| Independent Variable (X) | The variable used for prediction |
Check out Most Repeated Computer Awareness Questions for SSC CGL Tier 2
4. Regression Lines
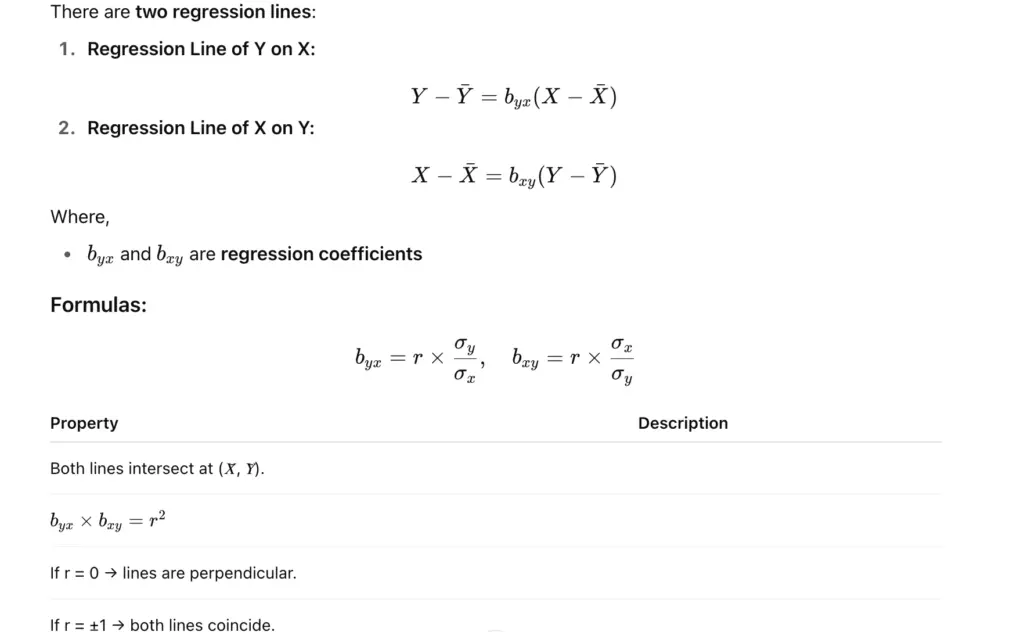
Use: Regression helps in forecasting for example, predicting sales based on advertisement spend.
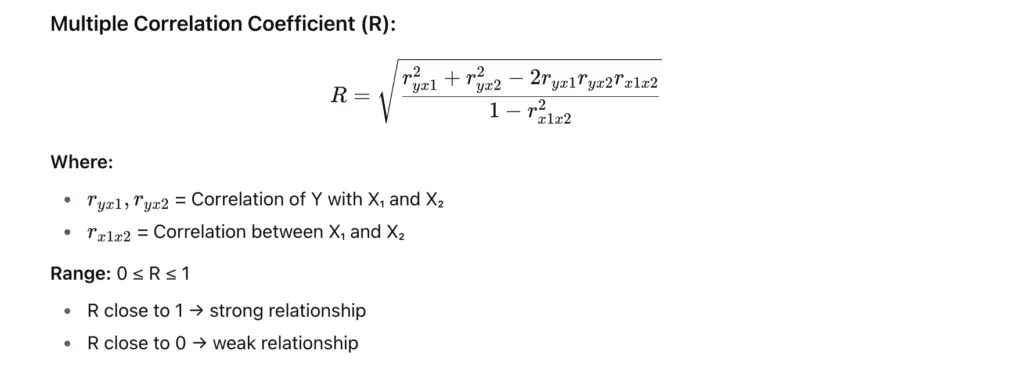
5. Multiple Correlation
Definition
When we study the relationship between one dependent variable and two or more independent variables, it is called multiple correlation.
Example:
Predicting a student’s performance (Y) based on study hours (X₁) and attendance (X₂).
6. Key Differences Between Correlation and Regression
| Basis | Correlation | Regression |
| Meaning | Measures degree of relationship between variables | Expresses the relationship mathematically |
| Purpose | To find strength & direction | To predict one variable from another |
| Number of Lines | One (no distinction) | Two (Y on X, X on Y) |
| Interchangeability | No dependent or independent variable | One variable is dependent on another |
| Value Range | −1 to +1 | Any real value |
Check other SSC JSO related blogs:
Key Takeaways
Below are the key takeaways:
- Correlation → Measures relationship strength.
- Regression → Provides predictive equations.
- Karl Pearson’s coefficient (r) and Spearman’s rank (rₛ) are most common in exams.
- Regression lines always pass through means (𝑋̄, 𝑌̄).
- Multiple correlation deals with more than two variables.
- Formula shortcuts and properties are frequently asked in Paper II (Statistics).
FAQs on Correlation and Regression
Q1. What is the difference between correlation and regression?
Correlation measures the degree of relationship, while regression shows how one variable predicts another.
The value of r always lies between −1 and +1.
It is used when data is ranked or qualitative in nature.
They represent the rate of change in one variable due to a change in another variable.
It shows how a dependent variable is influenced by two or more independent variables.
- SSC CGL 2025 Tier 1 Question Papers, Shift-Wise PYPs, Download PDFs
- SSC CGL & CHSL Maths Tricks, Check Basics & Speed
- SSC CGL vs SSC CHSL: Key Differences Explained for 2026
- Most Repeated Quantitative Aptitude Questions for SSC CHSL 2026
- SSC CGL Average Questions with Solutions, Download PDF
- Physics Questions asked in SSC CGL Exams with Solutions, Check Now

I’m Mahima Khurana, a writer with a strong passion for creating meaningful, learner-focused content especially in the field of competitive exam preparation. From authoring books and developing thousands of practice questions to crafting articles and study material, I specialize in transforming complex exam-related topics into clear, engaging, and accessible content. I have first hand experience of 5+ months in SSC Exams. Writing, for me, is not just a skill but a way to support and guide aspirants through their preparation journey one well-written explanation at a time.