
In SSC CGL Tier 2, SSC JSO, Sampling Theory is an important part of Statistics. Understanding sampling helps in making inferences about a population using a sample. This blog covers population, sample, sampling techniques, errors, and sampling distributions with easy explanations.
1. Population and Sample
In statistics, understanding the difference between a population and a sample is fundamental, as it forms the basis for collecting data and making inferences about a larger group.
| Term | Definition | Example |
| Population | Complete set of items or individuals under study | All employees of a company |
| Sample | Subset of population selected for analysis | 100 employees selected randomly |
Also check out Most Repeated Quantitative Aptitude Questions for SSC CGL Tier 2
2. Sampling Techniques
Sampling techniques are divided into probability and non-probability methods.
| Type | Technique | Description | Use / Example |
| Probability | Simple Random Sampling | Every item has an equal chance | Drawing 50 names randomly |
| Probability | Systematic Sampling | Every kth item is selected | Every 10th student in a list |
| Probability | Stratified Sampling | Population divided into strata, samples from each | Sample of students by grade |
| Probability | Cluster Sampling | Population divided into clusters, select entire clusters | Randomly select 3 schools |
| Non-Probability | Convenience Sampling | Select easily available items | Survey friends in a class |
| Non-Probability | Judgmental / Purposive | Select based on researcher’s judgment | Expert opinion survey |
Also check out Most Repeated Quantitative Aptitude Questions for SSC CGL Tier 2
3. Sampling Errors
Sampling errors occur when a sample does not perfectly represent the population.
| Error Type | Description | Example |
| Random Error | Due to chance variation in sample | Selecting 100 students randomly may slightly differ from population mean |
| Systematic Error / Bias | Consistent error in one direction | Survey conducted only in morning → misses absent students |
| Non-Sampling Error | Errors not related to sampling | Data entry mistakes, misreporting |
Check out Most Repeated Reasoning Questions for SSC CGL Tier 2
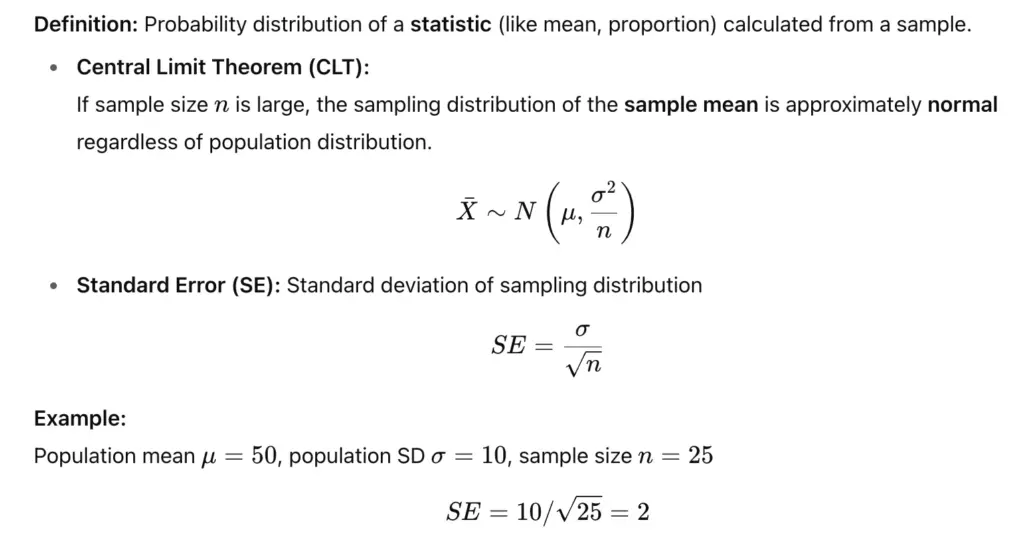
4. Sampling Distribution
Check out Most Repeated Computer Awareness Questions for SSC CGL Tier 2
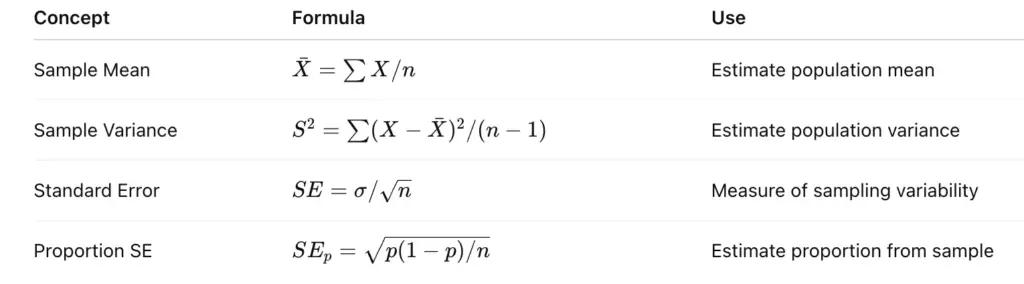
5. Key Formulas for SSC CGL
In SSC CGL Tier 2, memorizing key formulas for sampling theory helps quickly calculate sample statistics, standard errors, and make accurate inferences about the population.
Key Takeaways
- Population is the whole group, sample is a subset.
- Probability sampling → each element has known chance; Non-probability → chance unknown.
- Sampling errors can be random or systematic.
- Sampling distribution → distribution of sample statistics; CLT allows normal approximation for large samples.
- Standard error quantifies sample variability.
Check other SSC JSO related blogs:
FAQs on Sampling Theory
Population is the whole group; sample is a subset used for analysis.
Divide population into strata and select samples from each stratum.
Error due to difference between sample statistics and population parameters.
For large sample size, the distribution of sample mean is approximately normal regardless of population shape.
Sampling techniques are of two main types:
Probability sampling – each element has a known chance of selection (e.g., random, stratified).
Non-probability sampling – selection based on convenience or judgment.
- SSC CGL 2025 Tier 1 Question Papers, Shift-Wise PYPs, Download PDFs
- SSC CGL & CHSL Maths Tricks, Check Basics & Speed
- SSC CGL vs SSC CHSL: Key Differences Explained for 2026
- Most Repeated Quantitative Aptitude Questions for SSC CHSL 2026
- SSC CGL Average Questions with Solutions, Download PDF
- Physics Questions asked in SSC CGL Exams with Solutions, Check Now
I’m Mahima Khurana, a writer with a strong passion for creating meaningful, learner-focused content especially in the field of competitive exam preparation. From authoring books and developing thousands of practice questions to crafting articles and study material, I specialize in transforming complex exam-related topics into clear, engaging, and accessible content. I have first hand experience of 5+ months in SSC Exams. Writing, for me, is not just a skill but a way to support and guide aspirants through their preparation journey one well-written explanation at a time.