
The Employment-Unemployment Survey (EUS) conducted by NSSO under MoSPI offers the most comprehensive historical snapshot of India’s labour market. Its quinquennial rounds, such as the 68th (2011–12), laid the groundwork for understanding employment patterns across gender, rural–urban divides, and economic sectors. The survey has since been succeeded by the Periodic Labour Force Survey (PLFS), which provides frequent and up-to-date data on employment trends.
Background & Objectives of the Survey
The Employment-Unemployment Survey (EUS) conducted by the National Sample Survey Office (NSSO) was one of the most detailed sources of labour market information in India. Its main objective was not only to measure how many people were employed or unemployed but also to understand the quality, nature, and intensity of their work. This was especially important for India, where informal jobs, underemployment, and seasonal work are widespread.
The survey focused on three core indicators: Labour Force Participation Rate (LFPR), Worker Population Ratio (WPR), and Unemployment Rate (UR). To measure these accurately, it used three reference frameworks:
| Framework | Reference Period | What It Captures | Example |
| Usual Status (US) | 365 days | Long-term activity, includes both principal and subsidiary work | A farmer who mainly cultivates but also works as a part-time laborer during off-season |
| Current Weekly Status (CWS) | 7 days | Short-term employment or unemployment spells | A construction worker employed for 4 days in the last week |
| Current Daily Status (CDS) | Each day of last 7 days | Intensity of employment (even part of a day is counted) | A tailor who worked 3 hours a day for 5 days is partly employed under CDS |
Methodology of the Employment-Unemployment Survey
The EUS was based on large-scale household surveys that covered both rural and urban areas across all states and union territories. It followed a scientifically designed sampling framework to ensure representation of India’s diverse population.
Each round, such as the 68th round (2011–12), used a detailed questionnaire known as Schedule 10. This collected data on:
- Type and duration of work
- Sector of employment (formal/informal)
- Wages or earnings
- Educational background of workers
- Preferences for alternative jobs
Respondents were asked about their usual activity status, the time spent in different activities, and even seasonal variations in employment. For example, a rural worker might report farming during the harvest season but remain underemployed during lean months.
By combining US, CWS, and CDS measures, the survey provided insights into both long-term employment patterns and short-term fluctuations. This methodology made the EUS a reliable tool for policymakers to track changes in labour markets over time and design employment-related programs.
Key Indicators: LFPR, WPR & Unemployment Rate
The Employment-Unemployment Survey (EUS) focused on three core labour market indicators that provide a complete picture of India’s workforce:
- Labour Force Participation Rate (LFPR) – The proportion of the working-age population (15 years and above) that is either employed or actively seeking work. It shows how engaged people are in the labour market.
- Worker Population Ratio (WPR) – The proportion of the total population that is actually employed. This tells us how many people are contributing to economic activity.
- Unemployment Rate (UR) – The share of the labour force that is available for work but unable to find employment. It is a measure of the pressure on the job market.
Illustrative Table: Difference Between LFPR, WPR, and UR
| Indicator | Formula | What It Shows | Example |
| LFPR | (Labour Force ÷ Working-age Population) × 100 | How many people are engaged in the labour market (employed + unemployed but seeking jobs) | If 600 out of 1,000 adults are working or looking for work, LFPR = 60% |
| WPR | (Employed ÷ Total Population) × 100 | How many people are actually employed in the population | If 550 out of 1,000 adults are employed, WPR = 55% |
| UR | (Unemployed ÷ Labour Force) × 100 | Share of job-seekers who remain unemployed | If 50 out of 600 in the labour force are jobless, UR = 8.3% |
Why These Indicators Matter
- LFPR highlights participation differences such as why female LFPR is much lower than male LFPR in India.
- WPR shows the share of the population contributing to the economy, which is critical for planning resources.
- UR reflects the level of stress in the job market and helps measure the effectiveness of employment policies.
Together, these three indicators provide a complete picture of labour market health not just how many people are working, but also how many want to work and cannot find jobs.
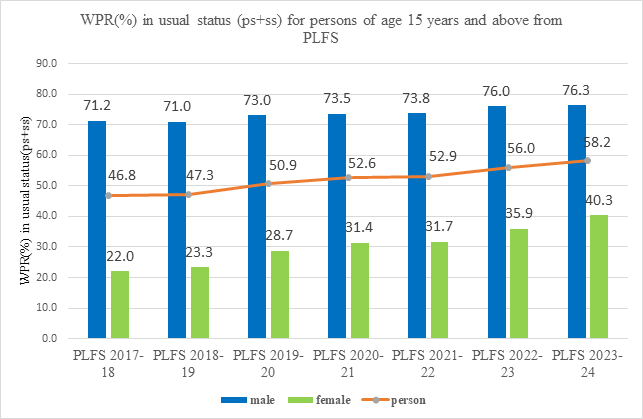
Latest Trends (PLFS 2023–24)
Below is a visual summary of trends in LFPR and Unemployment Rate (UR) from 2017–18 to 2023–24.
Trends observed:
- LFPR (CWS): Rural surged from ~48.9% (2017–18) to ~58.9% (2023–24); urban rose from ~47.1% to ~50.8%. Male LFPR increased from ~75.1% to ~77.5%, and female LFPR from ~21.1% to ~35.6%.
- Unemployment Rate (UR): Rural UR fell from ~5.3% to ~2.5%; urban UR dropped from ~7.7% to ~5.1%; overall UR moved from ~6.0% to ~3.2%
Major Findings from the Survey
The Employment-Unemployment Surveys (notably the 68th round, 2011–12) provided valuable insights into India’s labour market. These findings remain important as they form the baseline for later Periodic Labour Force Survey (PLFS) reports. The key observations are:
Rural vs Urban Trends (2017–24)
- Rural dominance: Nearly two-thirds of India’s workforce was engaged in rural areas, largely in agriculture and allied sectors.
- Agricultural dependence: Around 49% of workers were employed in agriculture (2011–12), reflecting limited diversification into industry and services in rural India.
- Urban shift: Urban areas showed greater employment in manufacturing, construction, and services, pointing to structural transformation.
Distribution of Workers (68th NSSO Round, 2011–12):
| Sector | Rural (%) | Urban (%) | Total (%) |
| Agriculture & Allied | 59.6 | 6.2 | 48.9 |
| Industry | 20.0 | 35.0 | 24.3 |
| Services | 20.4 | 58.8 | 26.8 |
Gender Disparities
- Female LFPR was significantly lower compared to males. In 2011–12, the female LFPR (usual status) was 23.3%, while for males it was 75.4%.
- Women were more engaged in unpaid family labour and informal work, highlighting persistent gender inequalities.
- Urban women showed even lower participation due to cultural, educational, and safety-related barriers.
Historical Perspective (2004–05)
- WPR in rural areas: 55% for males, 33% for females; urban: 55% males, 17% females
- WPR overall was around 42% (44% in rural, 37% in urban)
Employment Growth (2004–05 to 2011–12)
- Annual growth averaged only 2.59 million per year (UPS) and even lower at 1.91 million (UPSS)
- Between 2009–10 and 2011–12, employment rose by ~9 million, but still modest relative to earlier years
Comparison with Periodic Labour Force Survey (PLFS)
The PLFS offers a more frequent, annual view of labour indicators and allows for analysis of youth unemployment (15–29 age group).
- Overall unemployment for 2022–23 (US ps+ss): 3.2%
- Recent monthly data (May 2025): WPR = 51.7%, UR = 5.6% (CWS)
Monthly Shifts & Reliability
- UR increased from 5.1% (April 2025) to 5.6% (May 2025), indicating volatility
- July 2025 UR declined to 5.2%
- Experts warn official data may underreport unemployment; real UR could range between 10–35% according to some economists
Youth Unemployment by State
- Punjab, Haryana, Himachal show youth unemployment above national average (14.6%), with Himachal at a staggering 29.6% (urban female: 41.2%)
Below is a comprehensive table listing the Employment-Unemployment Survey (EUS) and Periodic Labour Force Survey (PLFS) reports from 2004 to 2024.
| Report Title | Download Link |
| Report on Sixth Annual Employment-Unemployment Survey (2016-17) | Download PDF |
| Report on Fifth Annual Employment – Unemployment Survey Volume I (2015-16) | Download PDF |
| Report on Fourth Annual Employment-Unemployment Survey Volume I (2013-14) | Download PDF |
| Report on Third Annual Employment & Unemployment Survey Volume I (2012-13) | Download PDF |
| Report on Second Annual Employment – Unemployment Survey Volume I (2011-12) | Download PDF |
| Report on Employment & Unemployment Survey (2009-10) | Download PDF |
Policy Implications & Government Measures
The findings from the Employment–Unemployment Survey reveal structural issues in India’s labour market, such as underemployment, informal sector dominance, and low female participation. These insights help policymakers design targeted interventions to improve employment quality, promote inclusive growth, and reduce unemployment.
- Improved LFPR and reduced UR suggest progress, but the quality of employment, especially for women, remains weak.
- Experts highlight low female participation (31.7% in 2023–24) and estimate it may take 20–30 years to reach G20 peers
- Addressing job market gaps requires investment in skills, gender-sensitive infrastructure, and better data accuracy.
Government Measures & Challenges in India’s Employment Landscape
Despite various initiatives like Skill India, MGNREGA, and Start-up India, India continues to face challenges such as youth unemployment, job quality gaps, and rural–urban disparities. Understanding these challenges is key to creating effective policies and sustainable employment opportunities.
- High informality in employment; typical household surveys often underrate women’s contributions and multiple jobs
- Official data may mask the true extent of unemployment, underemployment, and job insecurity.
FAQs
A: The EUS, conducted by the NSSO under MoSPI, is a quinquennial survey that provides detailed insights into India’s labour market, including employment patterns, unemployment, and workforce participation across gender, age, and rural–urban areas.
A: The survey measures three core indicators:
Labour Force Participation Rate (LFPR) – Percentage of working-age population engaged in or seeking work.
Worker Population Ratio (WPR) – Percentage of the total population actually employed.
Unemployment Rate (UR) – Share of the labour force actively seeking work but unemployed.
A: Employment is measured using three reference frameworks:
Usual Status (US): Work done in the last 365 days (long-term).
Current Weekly Status (CWS): Work done in the last 7 days.
Current Daily Status (CDS): Work done each day of the reference week, capturing intensity of employment.
A: Key findings included:
Rural workforce dominated employment, especially in agriculture (~49%).
Women’s LFPR was only 23.3% compared to 75.4% for men.
Urban employment was higher in manufacturing, construction, and services.
A: While EUS was quinquennial, PLFS provides annual and quarterly data, allowing timely insights into labour trends, youth unemployment, and sectoral shifts. PLFS also uses continuous data collection, enhancing reliability.
- RBI Grade B 2026 Complete 6 Month Study Plan, Check Details

- Important Topics for RBI Grade B Phase1 & 2, Subject Wise Topics List

- Life of RBI Grade B Officer, Complete RBI Grade B Officer Lifestyle

- RBI Grade B Phase 2 Descriptive Questions 2026, Download PDF

- RBI Grade B Officer Posting 2026, Locations, Career Growth

- RBI Grade B Latest Update 2026, Complete Notification Detail


Priti Palit, is an accomplished edtech writer with 4+ years of experience in Regulatory Exams and other multiple government exams. With a passion for education and a keen eye for detail, she has contributed significantly to the field of online learning. Priti’s expertise and dedication continue to empower aspiring individuals in their pursuit of success in government examinations.