In SSC CGL Tier 2, the Quantitative Abilities section often asks questions based on measures of central tendency. The main measures of central tendency are Mean, Median, and Mode, while Quartiles, Deciles, and Percentiles are used to split data into parts for easier interpretation. This blog explains each concept in a simple way with formulas and examples, making it easier to solve related SSC CGL Tier 2 questions accurately and quickly.s.
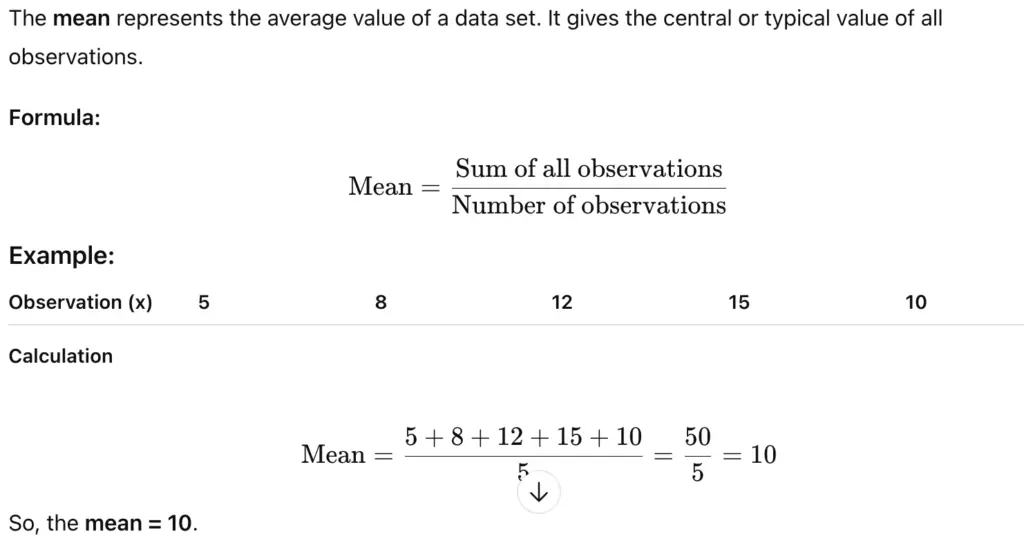
Mean (Arithmetic Mean)
Also check out Most Repeated Quantitative Aptitude Questions for SSC CGL Tier 2
Median
What is Median?
The median is the middle value of a data set when the numbers are arranged in ascending or descending order. If there are two middle values, take their average.
Steps to Find Median:
- Arrange the data in order.
- If n is odd → median = middle number
- If n is even → median = average of two middle numbers
Example Table:
| Observation (x) | 4 | 7 | 9 | 12 | 15 |
| Ordered Data | 4 | 7 | 9 | 12 | 15 |
Median:
Middle value = 9
Check out Most Repeated Reasoning Questions for SSC CGL Tier 2
Mode
What is Mode?
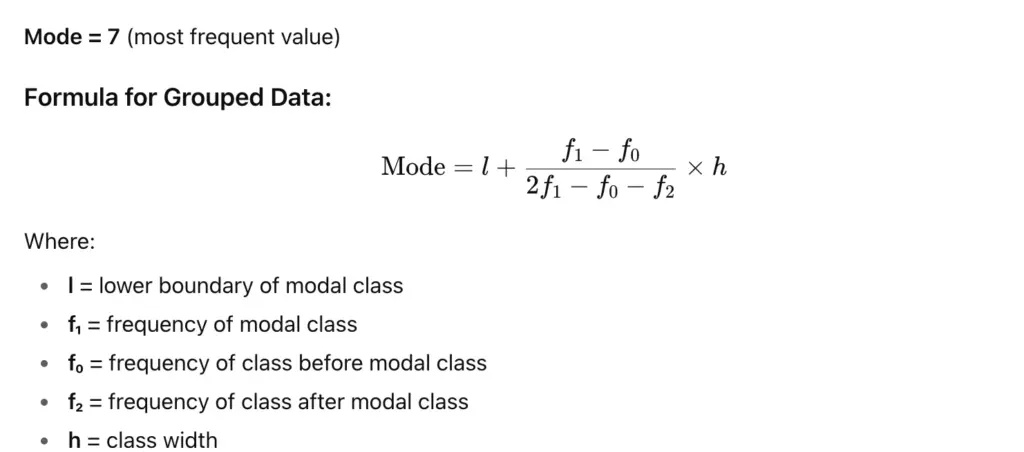
Mode is the value that occurs most frequently in a data set. A data set can be unimodal, bimodal, or multimodal depending on the number of repeated values.
Example Table:
| Observation (x) | 3 | 7 | 7 | 5 | 9 | 7 |
| Frequency (f) | 1 | 3 | 1 | 1 |
Also check out Most Repeated Quantitative Aptitude Questions for SSC CGL Tier 2
What are Quartiles?
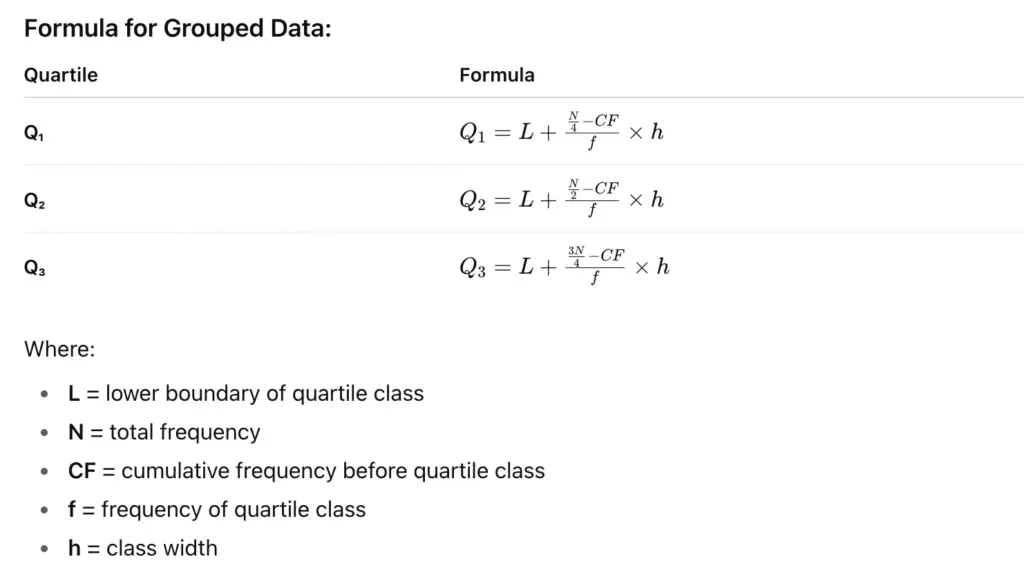
Quartiles divide a data set into four equal parts. Each part represents 25% of the data.
- Q1 (First Quartile): 25% of data lies below this value.
- Q2 (Second Quartile/Median): 50% of data lies below this value.
- Q3 (Third Quartile): 75% of data lies below this value.
Formula to find Quartiles in a grouped data set:
Check out Most Repeated Computer Awareness Questions for SSC CGL Tier 2
Deciles
What are Deciles?
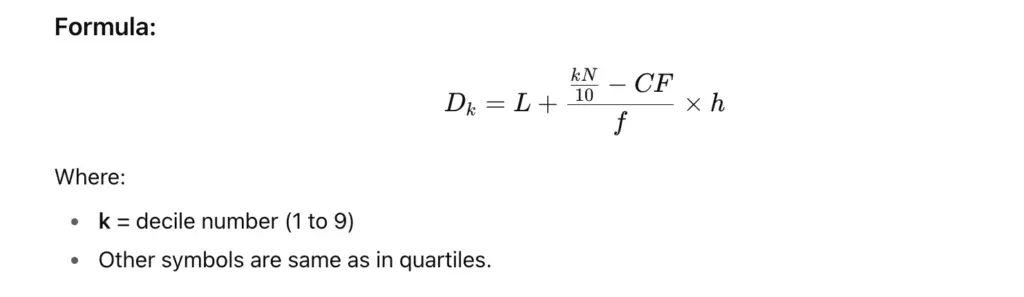
Deciles divide a data set into ten equal parts, each representing 10% of the data.
- D1: 10% of data lies below this value
- D5: 50% of data lies below this value (also the median)
- D9: 90% of data lies below this value
Formula to find Deciles:
Percentiles
What are Percentiles?
Percentiles divide a data set into 100 equal parts, each representing 1% of the data.
- P10: 10% of data lies below this value
- P25: 25% of data lies below this value (same as Q1)
- P90: 90% of data lies below this value
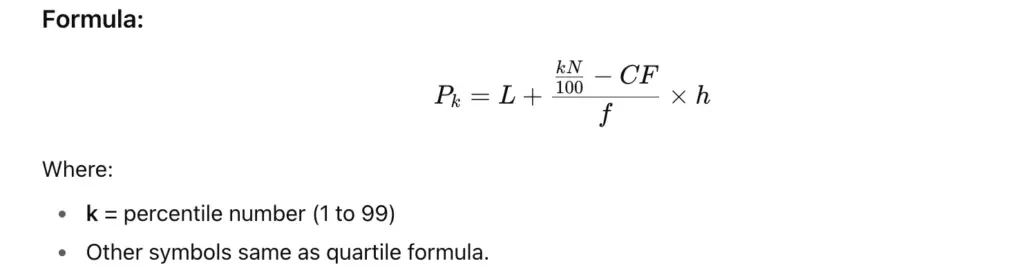
Where:
- k = percentile number (1 to 99)
- Other symbols same as quartiles formula
Check out SSC CGL Exam Pattern
Key Points to Remember
Below are the key points to remember:
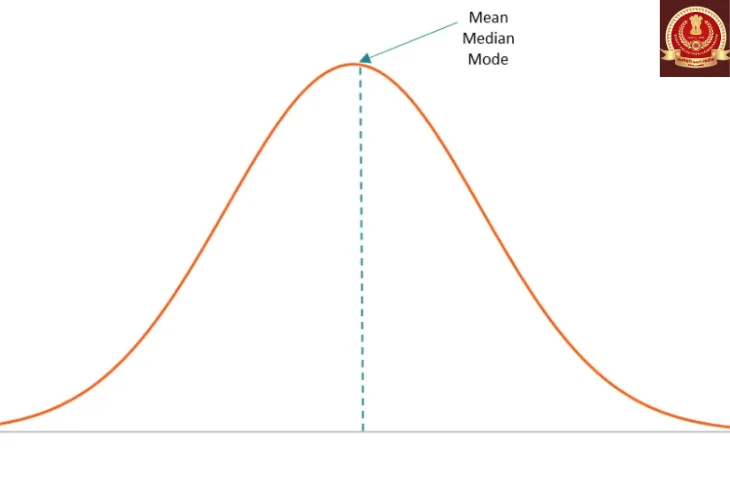
- Mean uses all values; median is middle value; mode is most frequent.
- For skewed data, median and mode are better than mean.
- Quick formulas and examples help solve SSC CGL questions fast.
- Quartiles, Deciles, and Percentiles help in dividing data for analysis.
- Median, quartiles, deciles, and percentiles can be solved using grouped or ungrouped data formulas.
- Questions may include finding missing values, cumulative frequency analysis, or range calculations.
- Practicing previous year SSC CGL questions on these topics helps in quick calculations during exams.
Check other SSC JSO related blogs:
Qualified SSC CGL Tier 1? Get ready for Tier 2 Exam, check out the below blogs:
FAQs
The main measures are Mean, Median, and Mode. They summarize a large data set with a single representative value.
They are used to analyze data distribution, find relative standing, and answer questions on grouped or ungrouped data quickly.
Median is the middle value of an arranged data set. For an odd number of observations, it’s the middle value. For even observations, it’s the average of the two middle values.
Mode is the value that occurs most frequently in a data set. A set may have one mode, multiple modes, or no mode.
Quartiles divide the data into four equal parts.
Q1 (1st Quartile) = 25% of data below
Q2 (2nd Quartile / Median) = 50% of data below
Q3 (3rd Quartile) = 75% of data below
Deciles divide data into 10 equal parts.
D1 = 10% of data below
D2 = 20% of data below … up to D9 = 90% of data below
Percentiles divide data into 100 equal parts.
P25 = 25% of data below
P50 = 50% of data below (same as median)
P75 = 75% of data below
- SSC CGL पोस्ट प्रेफरेंस फॉर्म 2026, विंडो 9 मार्च से 12 मार्च तक खुली
- SSC CGL Post Preference Form 2026, Window Open from 9th to 12th March
- Important Questions on Fundamental Rights for Railway Exams, Download PDF
- Nitin’s SSC CGL Success Story and His Preparation Strategy
- SSC CGL Tier 2 Weightage of English and Quants, Check Here
- Most Repeated English Questions for SSC CGL Tier 2

I’m Mahima Khurana, a writer with a strong passion for creating meaningful, learner-focused content especially in the field of competitive exam preparation. From authoring books and developing thousands of practice questions to crafting articles and study material, I specialize in transforming complex exam-related topics into clear, engaging, and accessible content. I have first hand experience of 5+ months in SSC Exams. Writing, for me, is not just a skill but a way to support and guide aspirants through their preparation journey one well-written explanation at a time.