In SSC CGL Tier 2, especially for the Junior Statistical Officer (JSO) post, understanding Measures of Dispersion is very important. Dispersion shows how spread out the data is around the central value. While measures like Mean, Median, and Mode give a single representative value, dispersion helps us understand how consistent or varied the data is.
What is Dispersion?
Dispersion tells us how much the data values differ from each other or from the average.
In simple words, it measures the spread or variability in a data set. If all values are close to each other, dispersion is small. If values are far apart, dispersion is large.
Also check out Most Repeated Quantitative Aptitude Questions for SSC CGL Tier 2
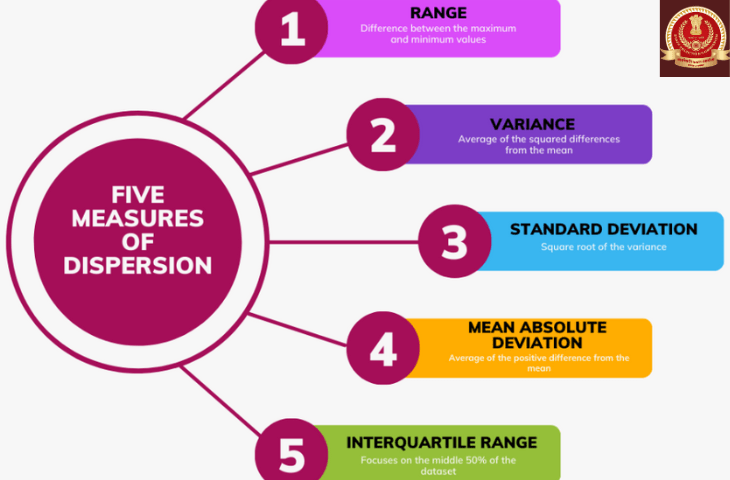
Types of Measures of Dispersion
The main types of measures of dispersion are:
| Type of Measure | Definition | Formula / Method |
| Range | Difference between the largest and smallest value in a dataset. | Range = Largest Value − Smallest Value |
| Quartile Deviation (Q.D.) | Measures the spread of the middle 50% of data between Q₁ and Q₃. | Q.D. = (Q₃ − Q₁) / 2 |
| Mean Deviation (M.D.) | Average of absolute deviations from the mean, median, or mode. | M.D. = (Σ |
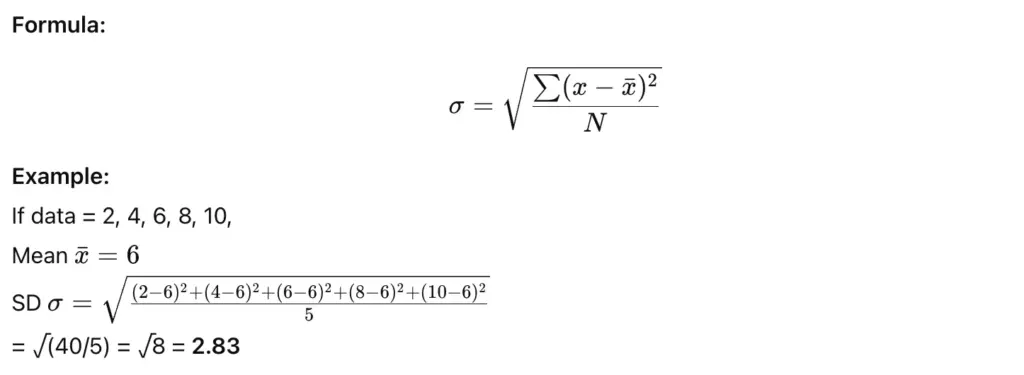
| Standard Deviation (S.D.) | Square root of average of squared deviations from the mean. | S.D. = √(Σ(x − 𝑥̄)² / N) |
| Relative Measures of Dispersion | Expresses dispersion as a percentage or ratio for comparison. | – Coefficient of Range = (L − S)/(L + S) – Coefficient of Q.D. = (Q₃ − Q₁)/(Q₃ + Q₁) – Coefficient of M.D. = M.D./Mean – Coefficient of Variation (C.V.) = (S.D./Mean) × 100 |
Also check out Most Repeated Quantitative Aptitude Questions for SSC CGL Tier 2
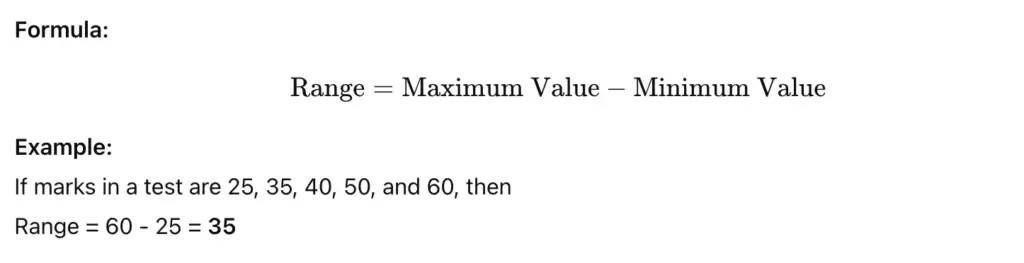
1. Range
Definition:
Range is the simplest measure of dispersion. It is the difference between the highest and lowest values in a data set.
Use:
Range gives a quick idea about the spread of data but is affected by extreme values.
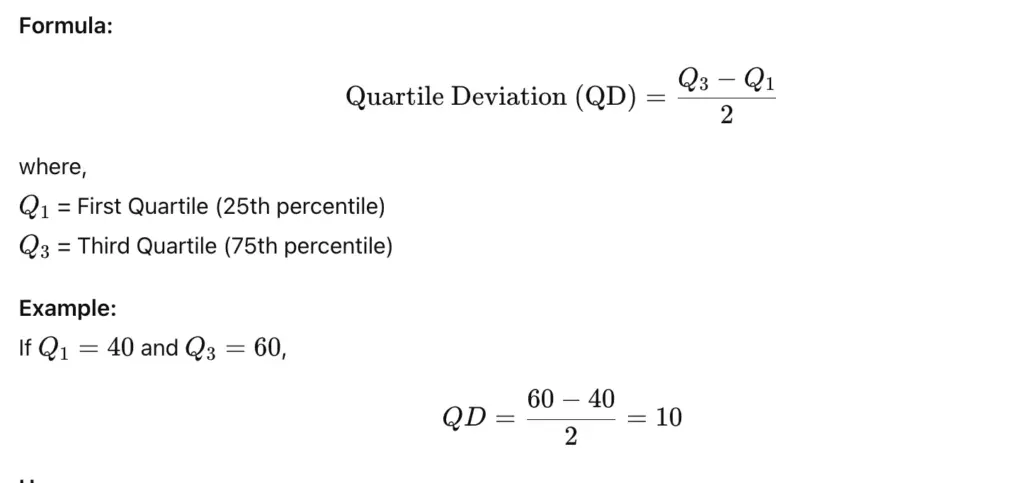
2. Quartile Deviation (QD)
Definition:
Quartile Deviation, also called Semi-Interquartile Range, measures the spread of the middle 50% of data.
Use:
Quartile Deviation is less affected by extreme values and is useful when data has outliers.
Check out Most Repeated Reasoning Questions for SSC CGL Tier 2
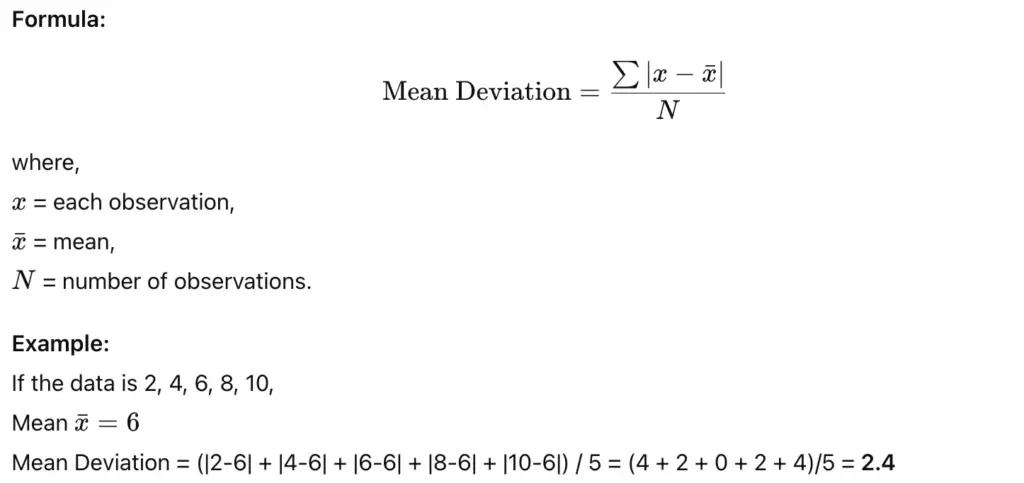
3. Mean Deviation (MD)
Definition:
Mean Deviation shows the average of absolute deviations of values from a central point (mean, median, or mode).
Use:
It shows average variation in the data and is better than range as it considers all observations.
Check out Most Repeated Computer Awareness Questions for SSC CGL Tier 2
4. Standard Deviation (SD)
Definition:
Standard Deviation is the most commonly used and accurate measure of dispersion. It measures how much each value deviates from the mean.
Use:
It is widely used in statistics as it considers all values and shows how data varies around the mean.
5. Relative Measures of Dispersion
Definition:
Relative dispersion compares the spread of two or more data sets, making it dimensionless.
Common relative measures include:
- Coefficient of Range
- Coefficient of Quartile Deviation
- Coefficient of Mean Deviation
- Coefficient of Standard Deviation (also called Coefficient of Variation)
| Measure | Formula |
| Coefficient of Range | (Max – Min) / (Max + Min) |
| Coefficient of Quartile Deviation | (Q3 – Q1) / (Q3 + Q1) |
| Coefficient of Mean Deviation | Mean Deviation / Mean |
| Coefficient of Variation (CV) | (Standard Deviation / Mean) × 100 |
Use:
It helps compare the stability or consistency between different data sets. A lower CV means more consistency.
Comparison of Different Measures of Dispersion
| Measure | Formula | Key Feature |
| Range | Max – Min | Simplest, affected by extremes |
| Quartile Deviation | (Q3 – Q1)/2 | Based on middle 50% data |
| Mean Deviation | ∑ | x – mean |
| Standard Deviation | √(∑(x – mean)² / N) | Most accurate and reliable |
| Coefficient of Variation | (SD/Mean) × 100 | Used for comparing data sets |
Check other SSC JSO related blogs:
Key Takeaways
Below are the key takeaways:
- Dispersion shows how data values vary around a central point.
- Standard Deviation is the most reliable measure used in SSC CGL Tier 2.
- Range is simple but less accurate due to outliers.
- Relative dispersion helps compare the variability between data sets.
- Practice numerical problems from each topic for JSO Paper 2 to build accuracy and speed.
Check out SSC CGL Exam Pattern
FAQs
Range is the simplest and quickest measure of dispersion.
Standard Deviation is most used because of its accuracy and importance in data analysis.
Absolute measures (like SD, MD) use actual units, while Relative measures (like CV) use ratios or percentages.
It means data is more consistent or stable.
They help in understanding variability, data interpretation, and solving statistical problems quickly and accurately.
- SSC CGL 2025 Tier 1 Question Papers, Shift-Wise PYPs, Download PDFs
- SSC CGL & CHSL Maths Tricks, Check Basics & Speed
- SSC CGL vs SSC CHSL: Key Differences Explained for 2026
- Most Repeated Quantitative Aptitude Questions for SSC CHSL 2026
- SSC CGL Average Questions with Solutions, Download PDF
- Physics Questions asked in SSC CGL Exams with Solutions, Check Now

I’m Mahima Khurana, a writer with a strong passion for creating meaningful, learner-focused content especially in the field of competitive exam preparation. From authoring books and developing thousands of practice questions to crafting articles and study material, I specialize in transforming complex exam-related topics into clear, engaging, and accessible content. I have first hand experience of 5+ months in SSC Exams. Writing, for me, is not just a skill but a way to support and guide aspirants through their preparation journey one well-written explanation at a time.