
In this post, we will discuss some Data Interpretation questions based on Bar graphs. Data interpretation can be of different types like bar graph, table, pie chart, caselets etc. Students can expect one set of bar graph questions in exams. It is easier to solve Bar graph questions by noting down the given data in the form of a table. Here are some Bar graph practice questions which will help you prepare for your upcoming examinations.
Bar graph practice questions
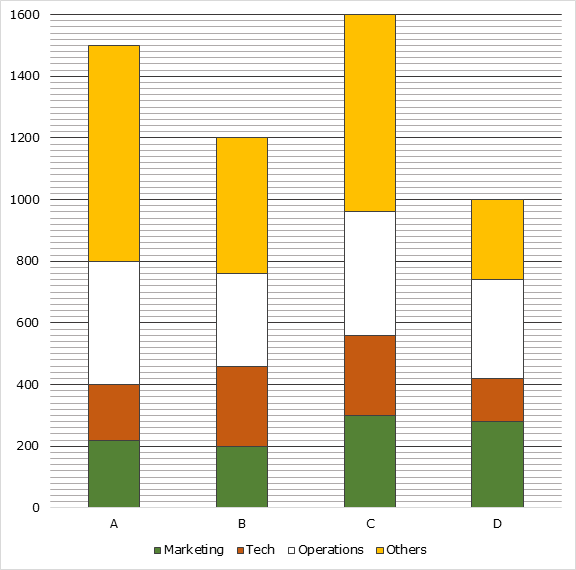
Directions for Questions 1 to 3: Following bar chart shows the number of employees in 4 companies working in 4 departments: Marketing, Tech, Operations and Others.
Attempt a FREE IBPS Clerk mock test here.
1. What percent of employees in company C are in operations?
(1) 10%
(2) 15%
(3) 20%
(4) 25%
(5) 30%
2. What is the ratio of the difference between the number of employees working in tech and operations in company A to that in company B?
(1) 11:2
(2) 11:3
(3) 12:5
(4) 10:3
(5) 10:7
3. The sum of the number of employees in marketing and operations in company D is what percent greater than the sum of the number of employees in tech and others in the same company?
(1) 55%
(2) 50%
(3) 60%
(4) 45%
(5) 40%
SOLUTION:
Answer key to Q1: 4
Required percentage = (400/1600)*100% = 25%
Answer key to Q2: 1
Required ratio = (400 – 180) : (300 – 260) = 11:2
Answer key to Q3: 2
Sum of the number of employees in marketing and operations in company D = 280 + 320 = 600
Sum of the number of employees in tech and others in company D
= 140 + 260 = 400
Required percentage = ((600 – 400)/400)*100% = 50%
Attempt a FREE SBI PO mock test here.
Directions for Questions 4 to 6: Study the following information carefully and answer the related questions.
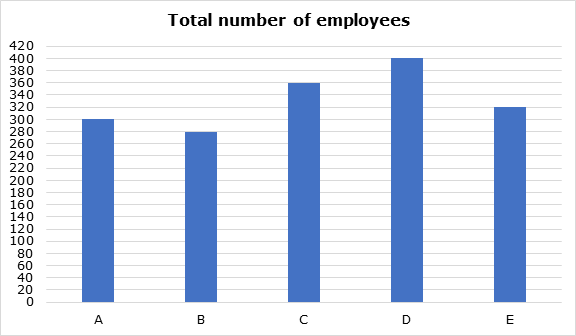
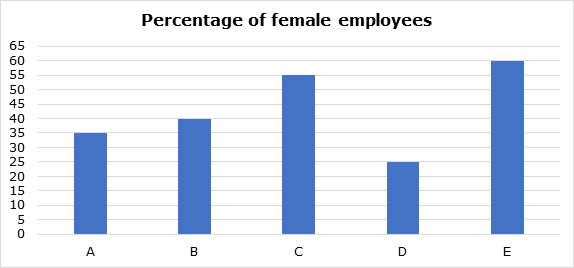
Following first bar graph represents the data regarding total number of employees (male + female) working in five different companies and second bar graph represents the percentage of female employees in the given company.
4. Total male employees in company B, D and E together are what percent of total employees in same company?
(1) 56.4%
(2) 58.7%
(3) 59.6%
(4) 60.1%
(5) 60.8%
5. Total number of female employees in all companies together are how much more/less than total number of male employees?
(1) 246
(2) 198
(3) 224
(4) 240
(5) 212
Attempt a FREE IBPS PO Mains mock test here.
6. If ‘m’ is the ratio of total male employees in company C and E together to total employees in company D and ‘n’ is the ratio of total female employees in company B and C together to total employees in company A, then what is the sum of m and n?
(1) 4(23/60)
(2) 1(91/120)
(3) 2(63/80)
(4) 1(87/100)
(5) 2(4/47)
SOLUTION:
Total employees in company A = 300
Female employees in company A = 35% of 300 = 105
Male employees in company A = 300 – 105 = 195
Total employees in company B = 280
Female employees in company B = 40% of 280 = 112
Male employees in company B = 280 – 112 = 168
Total employees in company C = 360
Female employees in company C = 55% of 360 = 198
Male employees in company C = 360 – 198 = 162
Total employees in company D = 400
Female employees in company D = 25% of 400 = 100
Male employees in company D = 400 – 100 = 300
Total employees in company E = 320
Female employees in company E = 60% of 320 = 192
Male employees in company E = 320 – 192 = 128
Practice various Quant topics by attempting sectional tests here.
Answer key to Q4: 3
Total employees in company B, D and E = 280 + 400 + 320 = 1000
Total male employees in company B, D and E = 168 + 300 + 128 = 596
Percentage = (596/1000) x 100 = 59.6%
Answer key to Q5: 1
Total number of female employees in all companies together
= 105 + 112 + 198 + 100 + 192 = 707
Total number of male employees in all companies together
= 195 + 168 + 162 + 300 + 128 = 953
Difference = 953 – 707 = 246
Answer key to Q6: 2
Total male employees in company C and E together = 162 + 128 = 290
Total employees in company D = 400
m = 290/400 = 29/40
Total female employees in company B and C together = 112 + 198 = 310
Total employees in company A = 300
n = 310/300 = 31/30
Therefore, m + n = (29/40) + (31/30) = 1(91/120)
We hope these Bar graph practice questions will help you ace the questions of these type of data interpretation. The first bar graph is of easy level and is common in most prelims level banking and insurance examinations. Do go through more such Bar graph practice questions by attempting Oliveboard’s sectional tests.
Study at your own convenience anywhere. Download the Oliveboard app now!

The most comprehensive online preparation portal for MBA, Banking and Government exams. Explore a range of mock tests and study material at www.oliveboard.in