In the SSC CGL Tier 2 SSC JSO Paper, questions from Statistical Inference test your understanding of how conclusions are drawn from data. This topic includes Estimation (Point and Interval) and Hypothesis Testing using different statistical tests like Z, t, Chi-square, and F tests. This blog explains each of these concepts in simple terms, with formulas and examples to help you prepare effectively.
What is Statistical Inference?
Statistical Inference means using sample data to make conclusions or generalizations about a larger population. Since collecting data for an entire population is often not possible, we analyze a sample and use statistical methods to estimate population parameters or test assumptions. There are two main parts of statistical inference:
- Estimation – Finding approximate values of population parameters.
- Hypothesis Testing – Checking whether assumptions about the population are true or not.
Also check out Most Repeated Quantitative Aptitude Questions for SSC CGL Tier 2
1. Estimation
What is Estimation?
Estimation is the process of finding the approximate value of an unknown population parameter (like mean or proportion) based on sample data.
There are two types of estimation:
- Point Estimation
- Interval Estimation
Point Estimation
Point estimation gives a single best value of a population parameter.
| Parameter | Point Estimator | Example |
| Population Mean (μ) | Sample Mean (x̄) | Average height of 100 students used to estimate population mean height |
| Population Proportion (p) | Sample Proportion (p̂) | Proportion of voters supporting a candidate from a small survey |
| Population Variance (σ²) | Sample Variance (s²) | Variance of sample marks used to estimate total variance |
Also check out Most Repeated Quantitative Aptitude Questions for SSC CGL Tier 2
Interval Estimation
Interval estimation gives a range of values within which the population parameter is expected to lie, along with a certain level of confidence.
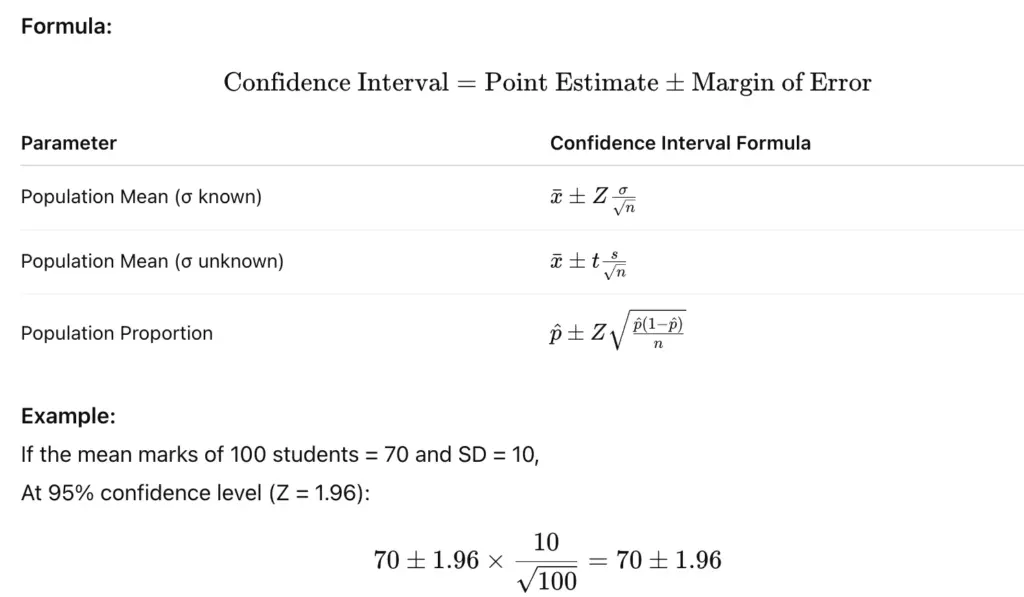
So, Confidence Interval = (68.04, 71.96)
This means we are 95% confident that the true population mean lies between 68.04 and 71.96.
Check out Most Repeated Reasoning Questions for SSC CGL Tier 2
2. Hypothesis Testing
Hypothesis testing is a method to decide whether there is enough statistical evidence in a sample to support or reject a claim (called a hypothesis) about a population parameter. Below are the steps in hypothesis testing:
| Step | Description |
| 1. Formulate Hypotheses | Set Null Hypothesis (H₀) and Alternative Hypothesis (H₁) |
| 2. Select Significance Level | Usually α = 0.05 or 0.01 |
| 3. Choose Appropriate Test | Z, t, Chi-square, or F test |
| 4. Compute Test Statistic | Using formulas based on sample data |
| 5. Decision | Compare test statistic with critical value to accept or reject H₀ |
Check out Most Repeated Computer Awareness Questions for SSC CGL Tier 2
Types of Errors
| Error Type | Description |
| Type I Error | Rejecting H₀ when it is true (False positive) |
| Type II Error | Accepting H₀ when it is false (False negative) |
Common Statistical Tests
Depending on the type of data and sample size, different tests are used in hypothesis testing.
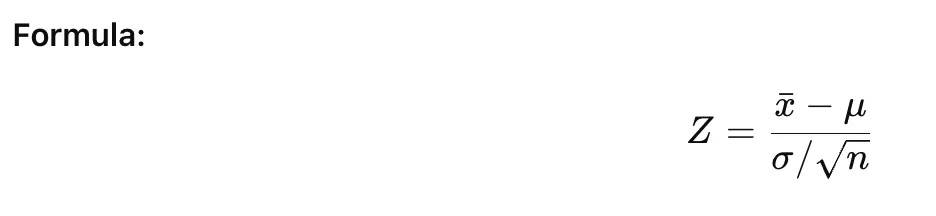
1. Z-Test
Used when:
- Population standard deviation (σ) is known
- Sample size is large (n ≥ 30)
| Test Type | Purpose |
| One-sample Z-test | To test if sample mean = population mean |
| Two-sample Z-test | To compare means of two samples |
| Proportion Z-test | To test equality of proportions |
2. t-Test
Used when:
- Population standard deviation (σ) is unknown
- Sample size is small (n < 30)

| Test Type | Purpose |
| One-sample t-test | Test sample mean vs population mean |
| Two-sample t-test | Compare two independent sample means |
| Paired t-test | Compare before-after observations of same group |
3. Chi-Square (χ²) Test
Used for:
- Testing goodness of fit or independence of two attributes in a contingency table.
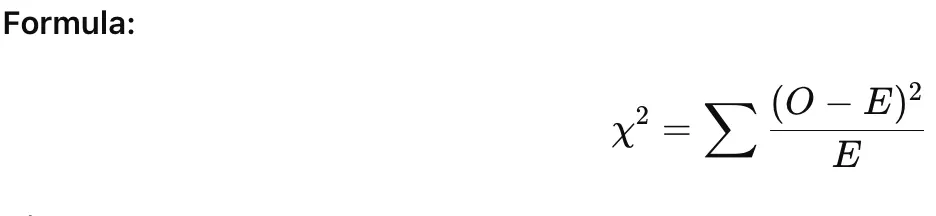
where,
O = Observed frequency,
E = Expected frequency.
| Test Type | Purpose |
| Goodness of Fit | Check if observed data follows a theoretical distribution |
| Test of Independence | Check if two categorical variables are related |
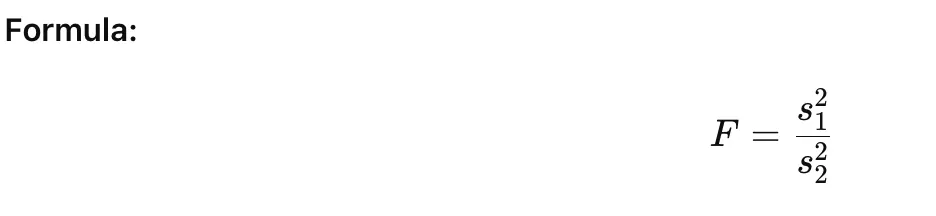
4. F-Test
Used for:
Comparing variances of two populations.
Example:
Used in ANOVA (Analysis of Variance) to test if means of multiple groups are equal.
| Test Type | Purpose |
| Two-Sample F-test | Compare variances |
| ANOVA | Compare means of more than two groups |
Confidence Intervals and Hypothesis Testing – Connection
Both estimation and hypothesis testing are linked:
- A confidence interval provides a range for the parameter.
- A hypothesis test checks if a specific value (like population mean) lies inside or outside that range.
If the hypothesized value lies outside the confidence interval, H₀ is rejected.
Check other SSC JSO related blogs:
Key Takeaways
- Statistical inference helps draw conclusions about populations using sample data.
- Point and Interval estimation give single or range-based parameter estimates.
- Z-test, t-test, Chi-square, and F-test are the core hypothesis tests for SSC CGL Tier 2 (JSO).
- Always identify the test type based on sample size, data type, and whether variance is known.
- Practice questions based on test statistic formulas and decision-making rules for better accuracy in the exam.
FAQs
Point estimation gives one single value, while interval estimation gives a range with a confidence level.
Use a Z-test when the population variance is known, or the sample size is large (≥ 30).
A t-test is used when the sample size is small and population standard deviation is unknown.
It is used to test the independence of two attributes or to check the goodness of fit of data.
An F-test compares variances or is used in ANOVA to test if group means are equal.
- SSC CGL पोस्ट प्रेफरेंस फॉर्म 2026, विंडो 9 मार्च से 12 मार्च तक खुली
- SSC CGL Post Preference Form 2026, Window Open from 9th to 12th March
- Important Questions on Fundamental Rights for Railway Exams, Download PDF
- Nitin’s SSC CGL Success Story and His Preparation Strategy
- SSC CGL Tier 2 Weightage of English and Quants, Check Here
- Most Repeated English Questions for SSC CGL Tier 2

I’m Mahima Khurana, a writer with a strong passion for creating meaningful, learner-focused content especially in the field of competitive exam preparation. From authoring books and developing thousands of practice questions to crafting articles and study material, I specialize in transforming complex exam-related topics into clear, engaging, and accessible content. I have first hand experience of 5+ months in SSC Exams. Writing, for me, is not just a skill but a way to support and guide aspirants through their preparation journey one well-written explanation at a time.