In economics, firms aim to lower costs and increase efficiency as they expand. Economies of scale explain why larger firms often enjoy lower average costs, while diseconomies of scale show why costs may rise after a certain point. For exam aspirants preparing for RBI Grade B, SEBI Grade A, NABARD, UPSC Economics, and EPFO, understanding these concepts is crucial. This blog covers the definitions, types, numerical examples, diagrams, and exam-oriented insights.
Understanding Economies of Scale
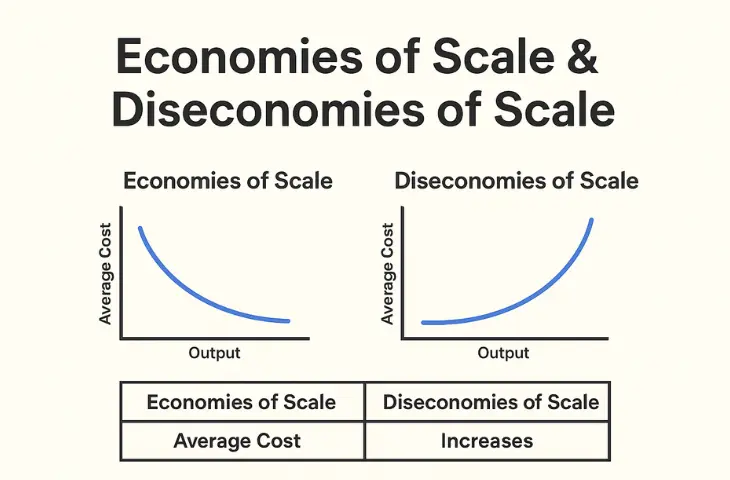
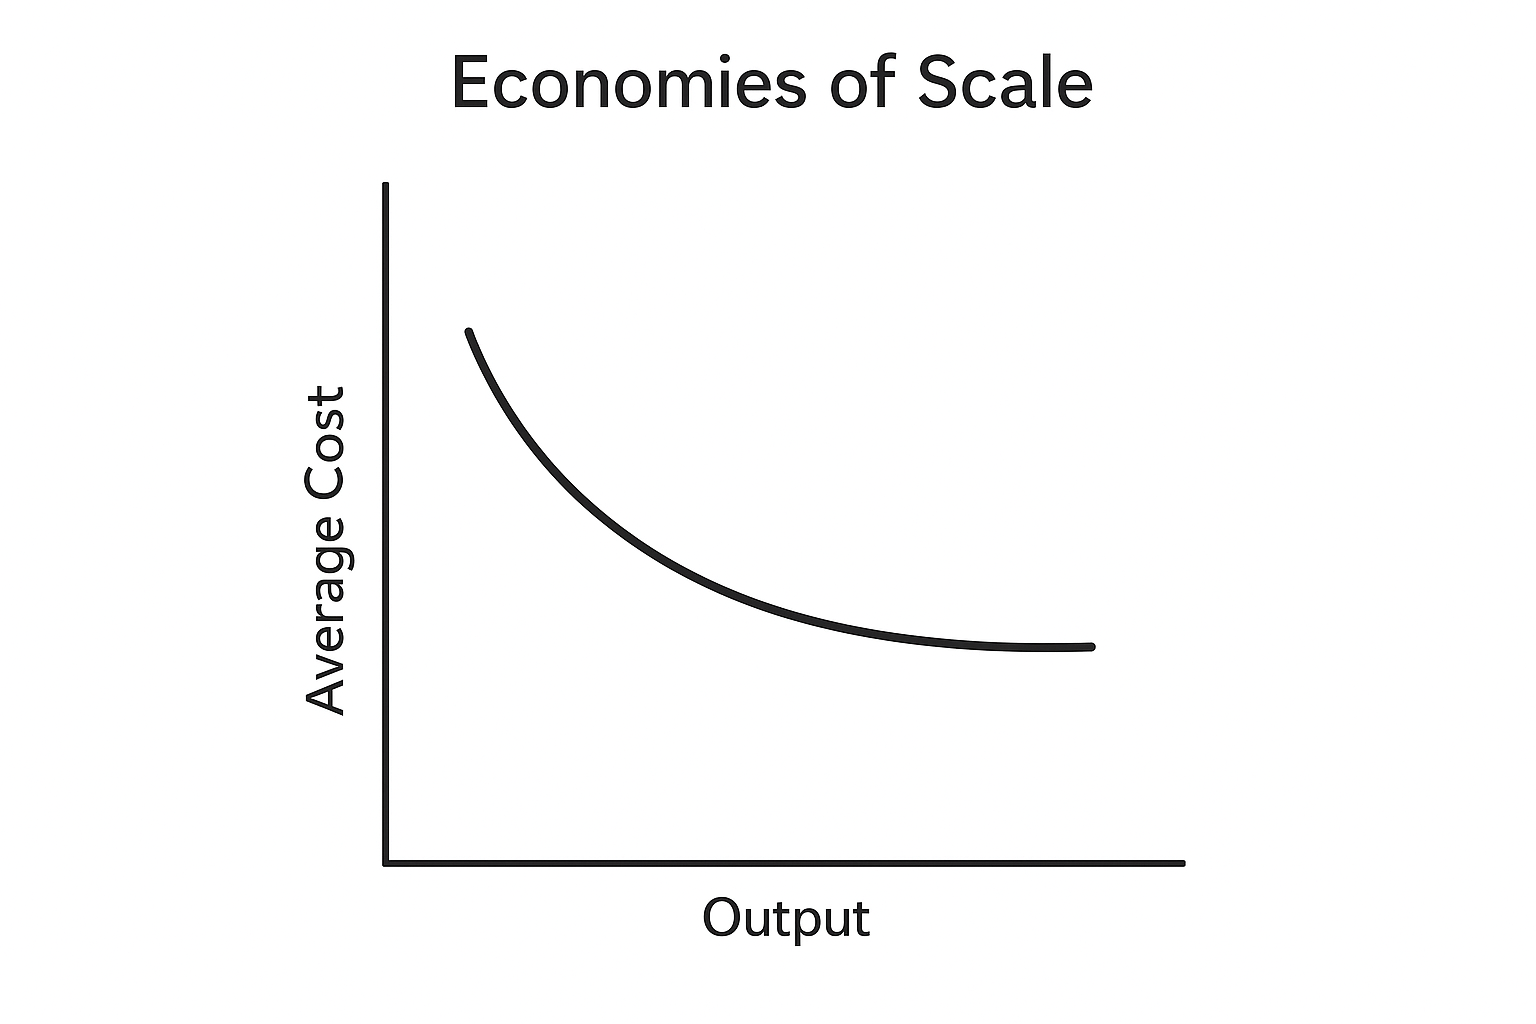
Economies of scale occur when the average cost of production falls as output increases. This happens because fixed costs spread over more units and firms use resources more efficiently.
Types of Economies of Scale:
- Internal Economies of Scale (within a firm):
- Technical economies – use of better machinery reduces per-unit cost.
- Managerial economies – specialization of managers improves efficiency.
- Financial economies – larger firms borrow at lower interest rates.
- Marketing economies – bulk advertising reduces average cost per unit.
- Risk-bearing economies – diversification reduces risk.
- External Economies of Scale (within an industry):
- Skilled labor availability – industries attract trained workers.
- Shared infrastructure – ports, transport, suppliers.
- Research clusters – knowledge spillover lowers cost for all firms
Understanding Diseconomies of Scale
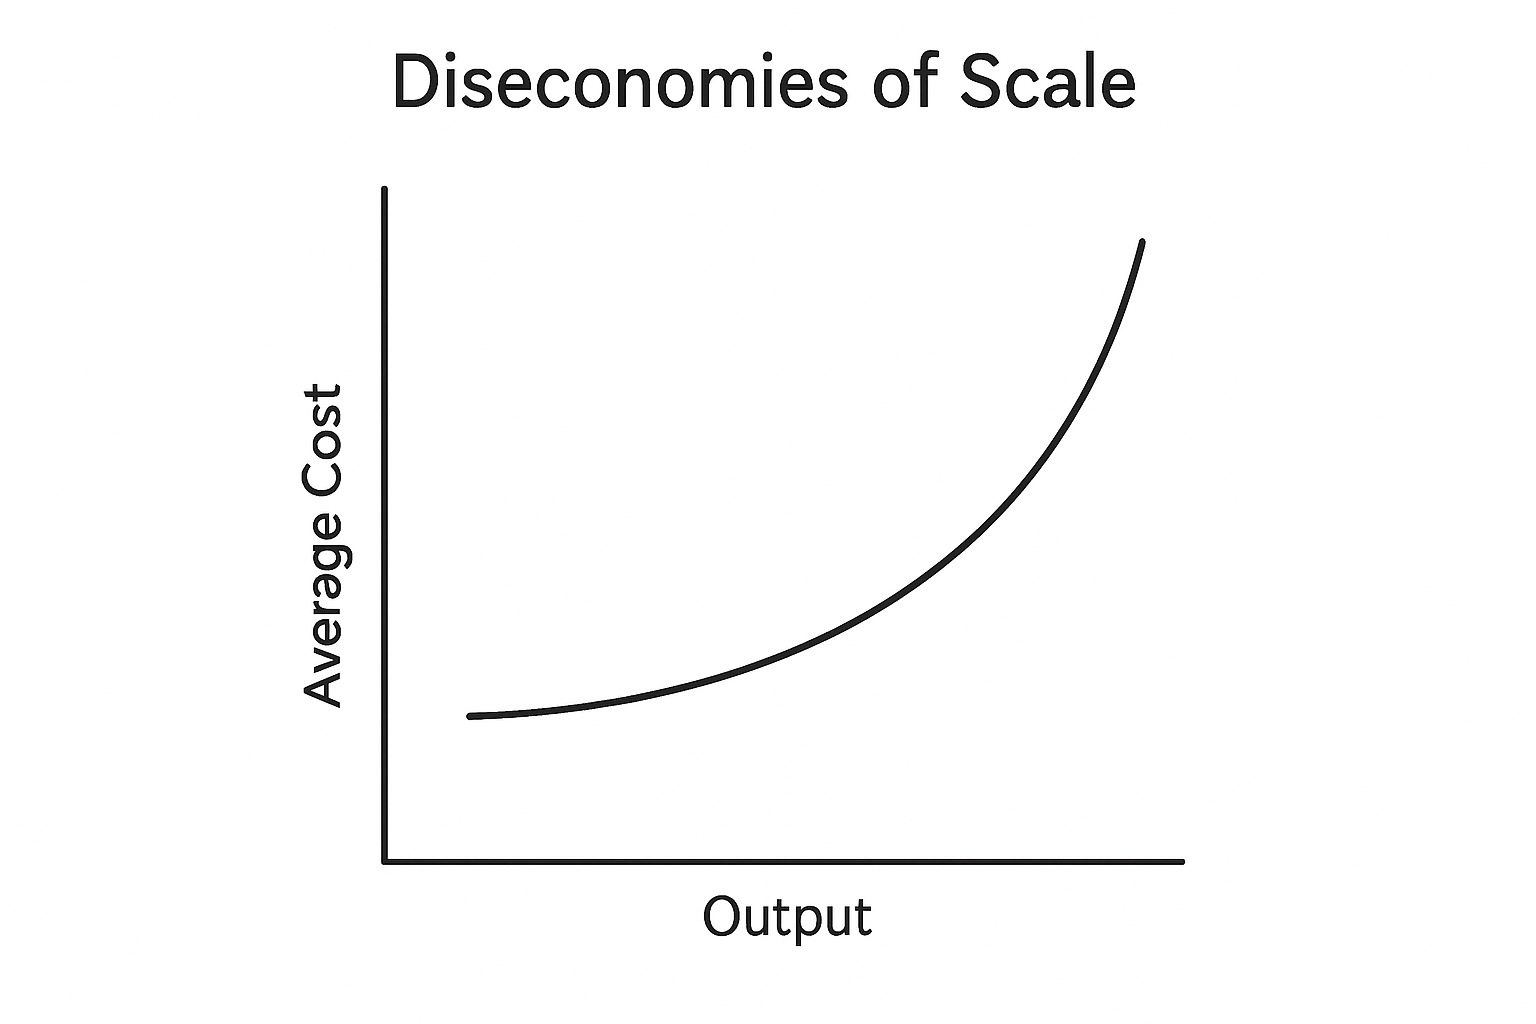
When a firm grows too large, it may face inefficiencies and rising costs. This is called diseconomies of scale.
Types of Diseconomies of Scale:
- Internal Diseconomies:
- Coordination problems – too many workers/managers slow decision-making.
- Bureaucracy – rigid rules increase costs.
- Worker alienation – employees feel less motivated in large firms.
- External Diseconomies:
- Rising input costs – demand for resources raises prices.
- Congestion – industries cluster, leading to traffic, delays, and higher costs
Numerical Example on Economies & Diseconomies of Scale
A clear numerical example makes it easier to understand how costs behave as output expands. By working through a step-by-step calculation, candidates can see exactly when economies kick in and when diseconomies start affecting the firm.
| Output (Units) | Total Cost (₹) | Average Cost (₹/unit) |
| 10 | 1000 | 100 |
| 20 | 1600 | 80 |
| 40 | 2800 | 70 |
| 60 | 4800 | 80 |
| 80 | 7200 | 90 |
Here, average cost falls from 100 to 70 (economies of scale), but rises again after 40 units (diseconomies of scale).
Long-Run Average Cost (LAC) Curve
The Long-Run Average Cost (LAC) curve shows how the per-unit cost of production changes when all inputs are variable, and firms can fully adjust their scale of operation. Unlike the short run, where at least one factor is fixed, the long run allows firms to expand or contract plant size, labor, and capital to achieve the most efficient level of output.
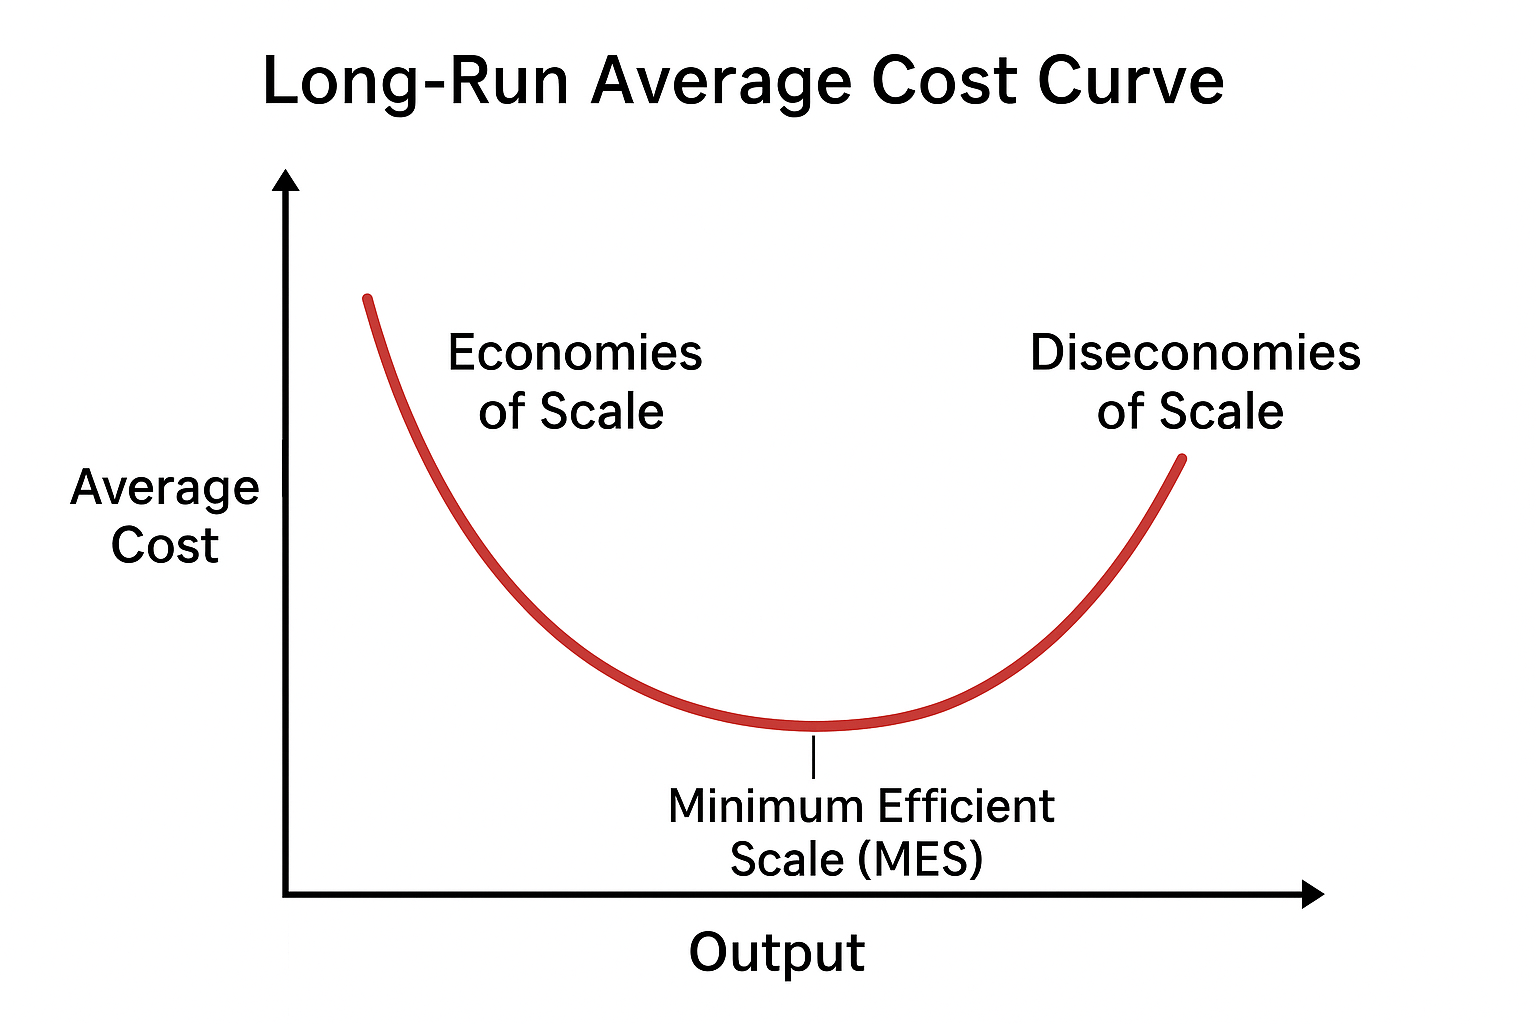
The LAC curve is typically U-shaped:
- Downward-sloping phase (Economies of Scale): As output increases, average costs fall because resources are used more efficiently, specialization improves, and fixed costs spread over larger output.
- Flat phase (Minimum Efficient Scale, MES): This is the point where costs are at their lowest, and the firm is producing at optimal scale.
- Upward-sloping phase (Diseconomies of Scale): Beyond a certain point, coordination problems, higher administrative costs, and inefficiencies set in, pushing average costs upward.
The LAC curve is not just theoretical it’s important for business decisions, pricing strategies, and exam answers. It helps explain why some industries (like airlines or steel) are dominated by a few large firms that achieve scale economies, while others (like restaurants) remain competitive with smaller firms.
Minimum Efficient Scale (MES)
The Minimum Efficient Scale (MES) is the smallest level of output at which a firm can produce at the lowest possible average cost in the long run. In other words, MES is the output level where the firm fully exploits economies of scale and achieves maximum efficiency.
- Before MES: Average costs decline as output rises, due to spreading of fixed costs, specialization, and bulk purchasing.
- At MES: Average costs reach their lowest point, and the firm achieves the most efficient production scale.
- Beyond MES: Producing more does not reduce costs further and may eventually lead to diseconomies of scale.
The MES is significant because it determines:
- The market structure of an industry (e.g., if MES is very high, only a few large firms can survive).
- The entry barriers for new firms (a high MES makes it difficult for small firms to compete).
- The cost competitiveness of firms in both domestic and global markets.
Real World Examples for Candidates
Understanding theory is easier when connected to real markets. From manufacturing giants to service industries, real-world cases of economies and diseconomies of scale help candidates relate concepts to current business practices and exam-oriented case studies.
- Airlines: Larger fleets reduce per-seat cost (economies), but congestion in busy airports raises costs (diseconomies).
- IT Companies: Shared R&D clusters reduce costs (economies), but large teams cause coordination problems (diseconomies).
- Automobiles: Robots reduce per-car cost, but too much scale may cause supply chain issues.
Exam Tip: Use “Airlines – Economies & Congestion Diseconomies” as a ready-made example.
How to Write a 10 Mark Answer?
To write a strong answer in exams like RBI/SEBI/NABARD:
- Start with a definition (economies & diseconomies).
- Add a diagram (LAC curve).
- Explain types (internal & external).
- Give a numerical example (short table).
- Conclude with real-world case + mention MES.
Comparison Table of Economies vs Diseconomies of Scale
A side-by-side table offers a quick revision tool. By comparing key differences between economies and diseconomies of scale, candidates can prepare faster for exams and answer short or long questions with clarity.
| Aspect | Economies of Scale | Diseconomies of Scale |
| Average Cost | Falls with output | Rises with output |
| Causes | Specialization, bulk buying, efficiency | Coordination failure, bureaucracy |
| Example Industry | Automobiles, Airlines (per-unit cost drop) | Telecom congestion, Bureaucratic firms |
| Exam Diagram | Falling part of U-shaped LAC curve | Rising part of U-shaped LAC curve |
FAQs
Economies of scale occur when a firm’s average cost per unit falls as output increases.
Diseconomies of scale happen when average costs rise as the firm becomes too large.
The LAC curve shows the relationship between output and average cost when all inputs are variable. It is typically U-shaped.
MES is the smallest output level at which a firm achieves the lowest possible average cost.
Yes. Initially, costs fall due to economies, but after a certain scale, diseconomies set in and increase costs.
- PFRDA Grade A Previous Year Papers PDF, Download Free PYPs

- RBI Bulletin 2026, Attempt Quiz and Download RBI Bulletin PDFs

- Attempt RBI Bulletin June 2026 Practice Quiz & Download PDF

- RBI Notification 2026 Practice Quiz and Download Free PDF

- Attempt RBI Notification June 2026 Practice Quiz & Download PDF

- PFRDA Grade A Salary 2026, Pay Scale, In-Hand Salary


Priti Palit, is an accomplished edtech writer with 4+ years of experience in Regulatory Exams and other multiple government exams. With a passion for education and a keen eye for detail, she has contributed significantly to the field of online learning. Priti’s expertise and dedication continue to empower aspiring individuals in their pursuit of success in government examinations.