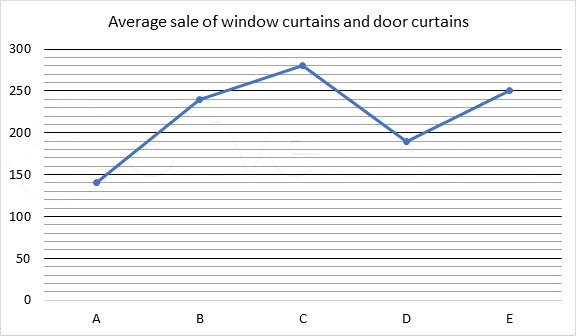
From the line graph, we have
| Store | Average sale of window curtains and door curtains |
| A | 140 |
| B | 240 |
| C | 280 |
| D | 190 |
| E | 250 |
Sale of window curtains and door curtains together in store A = 2 * 140 = 280
Let sale of window curtains in store A = 60% of sale of door curtains in store A
(sale of window curtains in store A): (sale of door curtains in store A) = 3: 5
Then, sale of window curtains in store A = 280 * 3/(3 + 5) = 105
And the sale of door curtains in store A = 280 - 105 = 175
Similarly, we can find the data for other four stores as shown below.
| Store | Sale of window curtains and door curtains together | Sale of window curtains | Sale of door curtains |
| A | 280 | 105 | 175 |
| B | 480 | 280 | 200 |
| C | 560 | 160 | 400 |
| D | 380 | 180 | 200 |
| E | 500 | 100 | 400 |
In store B:
Let the price of one window curtain and one door curtains are Rs.3a and Rs.4a respectively. Then,
196800 = 280 * 3a + 200 * 4a
196800 = 1640a
a = 120
Therefore, earnings on store B on door curtains = 200 * 4a = 200 * 4 * 120 = Rs.96000


 Study Notes
 Category