Directions :Study the data carefully and answer the following questions:
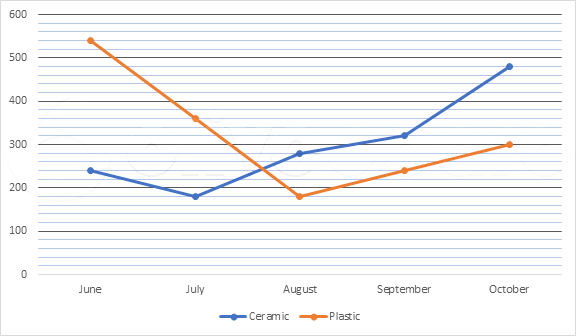
Below line graph shows the number of cups of two types (ceramic and plastic) sold by a shopkeeper in five months (June, July, August, September, and October):
Note:-
The ratio of number of plastic cups sold to the number of steel cups sold in each month is 6: 7.
What is the average number of cups of steel type sold in June, and August, together?
1.240
2.420
3.350
4.280
5.210
Correct Answer : 2
Solution :
In June:
Number of ceramic cups sold = 240
Number of plastic cups sold = 540
Number of steel cups sold = 540 * 7/6 = 630
Similarly, calculating the remaining data:
Ceramic
Plastic
Steel
June
240
540
630
July
180
360
420
August
280
180
210
September
320
240
280
October
480
300
350
Required average = (210 + 630)/2 = 420
IBPS RRB Clerk Previous Year Papers
Attempt IBPS RRB Clerk PYPs, get detailed solutions
IBPS RRB Clerk Prelims Mock Test
Attempt IBPS RRB Clerk Prelims Mocks in Latest Pattern
Create a free Oliveboard account to access all PYQs with solutions & video explanations


 Study Notes
 Category