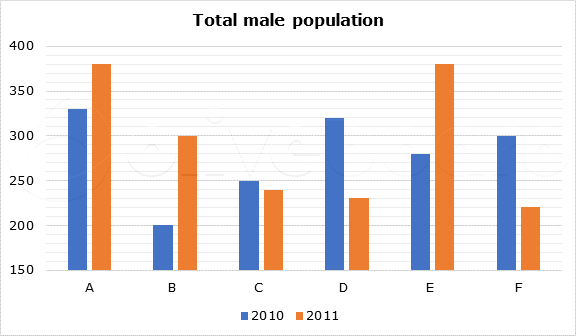
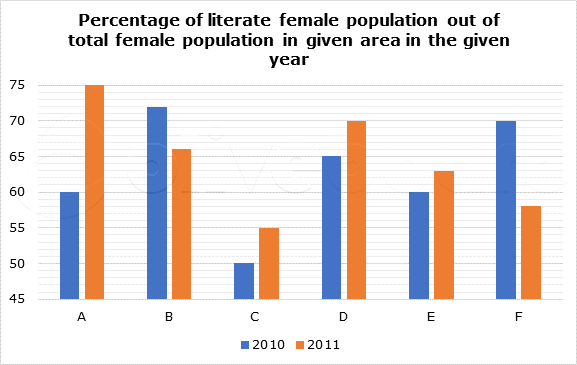
Exams

Study Notes
  • Regulatory
  • Teaching Exams
Mock Tests
  • Banking & Insurance
  • SSC Exams
  • Regulatory
  • UPSC
  • MBA Exams
  • Railway Exams
  • JAIIB-CAIIB Exams
  • Karnataka Exams
  • Tamil Nadu Exams
  • Judiciary Exams
  • Law Entrance Exams
  • Agriculture Exams
  • J&K Exams
  • UP Exams
  • Rajasthan Exams
  • Uttarakhand Exams
  • Punjab Exams
  • Haryana Exams
  • MP Exams
  • Defence Exams
  • Teaching Exams
  • Chhattisgarh Exams
Previous Year Papers
  • Banking
  • SSC
  • Regulatory
  • JAIIB
  • Teaching
  • Railways
Category
  • Banking & Insurance
  • SSC Exams
  • Regulatory
  • UPSC
  • MBA Exams
  • Railway Exams
  • JAIIB-CAIIB Exams
  • Karnataka Exams
  • Tamil Nadu Exams
  • Judiciary Exams
  • Law Entrance Exams
  • Agriculture Exams
  • Engineering Exams
  • J&K Exams
  • UP Exams
  • Rajasthan Exams
  • Uttarakhand Exams
  • Punjab Exams
  • Haryana Exams
  • Bihar Exams
  • MP Exams
  • Defence Exams
  • Teaching Exams
  • Himachal Pradesh Exams
  • Chhattisgarh Exams
  • SkillVertex Courses
Chhattisgarh Exams
Engineering Exams
Teaching Exams
Himachal Pradesh Exams
Chhattisgarh Exams

Previous Year Questions

Get Detailed Solutions for Previous Year Questions for Bank, SSC, Railways and Other Popular Government Exams

Question :

Directions : Study the following information carefully and answer the related questions.

Following first bar graph represents the total number of males in these areas, second bar graph represents the percentage of literate female population and table represents the difference between male and female population.

Total population in all given areas in 2010 = 3310

Total population in all given areas in 2011 = 3470

AreaDifference between male and female population
20102011
A6060
B5050
C2060
D12040
E11080
F3080

If in both the years(2010 and 2011), the female population of area B is less than that of male population, the total population of town B in 2011 is increased/decreased by what % than the total population of same town than previous year?

1. 66(2/3)%

2. 57(1/7)%

3. 28(3/4)%

4. 48(8/9)%

5. 37(3/11)%

Correct Answer : 2
Solution :
AreaMale populationPercentage of literate female populationDifference between male and female population
201020112010201120102011
A33038060%75%6060
B20030072%66%5050
C25024050%55%2060
D32023065%70%12040
E28038060%63%11080
F30022070%58%3080

In area B:

Female population in 2010 = 200 - 50 = 150

And, female population in 2011 = 300 - 50 = 250

Total female population in 2010 and 2011 together = 150 + 250 = 400

So, total population in 2010 = 200 + 150 = 350

And, total population in 2011 = 300 + 250 = 550

Increment = 550 - 350 = 200

Percentage = (200/350) x 100 = 57(1/7)%

RBI Grade B Previous Year Papers

Attempt RBI Grade B Phase 1 PYPs, get detailed solutions

RBI Grade B Phase 1 Mock Test

Attempt RBI Grade B Phase 1 Mocks in Latest Pattern

Create a free Oliveboard account to access all PYQs with solutions & video explanations

RBI Phase I PYP Test Series

RBI Grade B Phase 1 PYP 2024 - 8th September Shift 1

200 200 2 Hours
Free

RBI Grade B Phase 1 PYP 2024 - 8th September Shift 2

200 200 2 Hours

RBI Grade B Phase 1 PYP 2023 - 9th July Shift 1

200 200 2 Hours

RBI Grade B Phase 1 PYP 2023 - 9th July Shift 2

200 200 2 Hours

RBI Grade B Phase 1 PYP 2022 - 28th May Shift 1

200 200 2 Hours

RBI Grade B Phase 1 PYP 2022 - 28th May Shift 2

200 200 2 Hours

RBI Grade B Phase 1 PYP - 6th March Shift 1

200 200 2 Hours

RBI Grade B Phase 1 PYP - 6th March Shift 2

200 200 2 Hours

RBI Grade B Phase 1 PYP 2019 - 9th November Shift 1

200 200 2 Hours

RBI 2025 Phase I Test Series

RBI 2025 Phase I - 1

200 200 2 Hours
Free

RBI 2025 Phase I - 2

200 200 2 Hours

RBI 2025 Phase I - 3

200 200 2 Hours

RBI 2025 Phase I - 4

200 200 2 Hours

RBI 2025 Phase I - 5

200 200 2 Hours

RBI 2025 Phase I - 6

200 200 2 Hours

RBI 2025 Phase I - 7

200 200 2 Hours

RBI 2025 Phase I - 8

200 200 2 Hours

RBI 2025 Phase I - 9

200 200 2 Hours

RBI 2025 Phase I - 10

200 200 2 Hours

RBI 2025 Phase I - 11

200 200 2 Hours

RBI 2025 Phase I - 12

200 200 2 Hours

RBI 2025 Phase I - 13

200 200 2 Hours

RBI 2025 Phase I - 14

200 200 2 Hours

RBI 2025 Phase I - 15

200 200 2 Hours

RBI 2025 Phase I - 16

200 200 2 Hours

RBI 2025 Phase I - 17

200 200 2 Hours

RBI 2025 Phase I - 18

200 200 2 Hours

RBI 2025 Phase I - 19

200 200 2 Hours

Record Breaking Results in 2024-25 🎉

Niranjan Jain

Niranjan Jain

Rank #1

SBI PO

â–
Amit Mandal

Amit Mandal

Rank #1

IBPS PO

â–
S B Tanay Gaurav

S B Tanay Gaurav

Rank #1

RBI Gr. B

â–
Shubham Agrawal

Shubham Agrawal

Rank #1

SSC CGL

â–
Manjot Singh

Manjot Singh

Rank #1

SSC CGL (JSO)

â–
Rohit Chadhar

Rohit Chadhar

Rank #1

SSC CHSL

â–
Shekhar Kumar

Shekhar Kumar

Rank #8

RBI Gr. B

â–

Please wait...

Open in app